
Advanced Salesforce LWC debugging with Chrome Developer Tools

Times when a developer had to deploy the component to test each and every correction, or had to write tens of console.log in the code, have fortunately passed. Modern browsers give us lots of features for easy experimentation, debugging, and performance measuring. Today we will focus on the most popular browser (in the context of Salesforce development) and its developer tools – Chrome Dev Tools.
Spoiler alert: when I first learned how to use them, it was a game-changer in my frontend development pace and in the satisfaction I’ve started to gain while coding. Read on to feel the same!
Spoiler alert2: if you’re already an LWC master, Chrome Dev Tools warrior, and already know all the fundamentals, feel free to skip to the tips & tricks section of this post.
Prerequisites and basics
Before we start with the meat of the matter, let’s complete the prerequisites.
How to open Chrome Dev Tools
- Open any page in your Chrome browser – for example Salesforce org Setup home.
- Right-click anywhere and select "Inspect".
The Chrome Dev Console will appear. There are multiple tabs and tools there – I’m going to cover the most useful ones.
Alternatively, you can use the keyboard shortcuts: F12 or Ctrl+Shift+I on Windows/Linux and Fn+F12 or Cmd+Option+I on MAC.
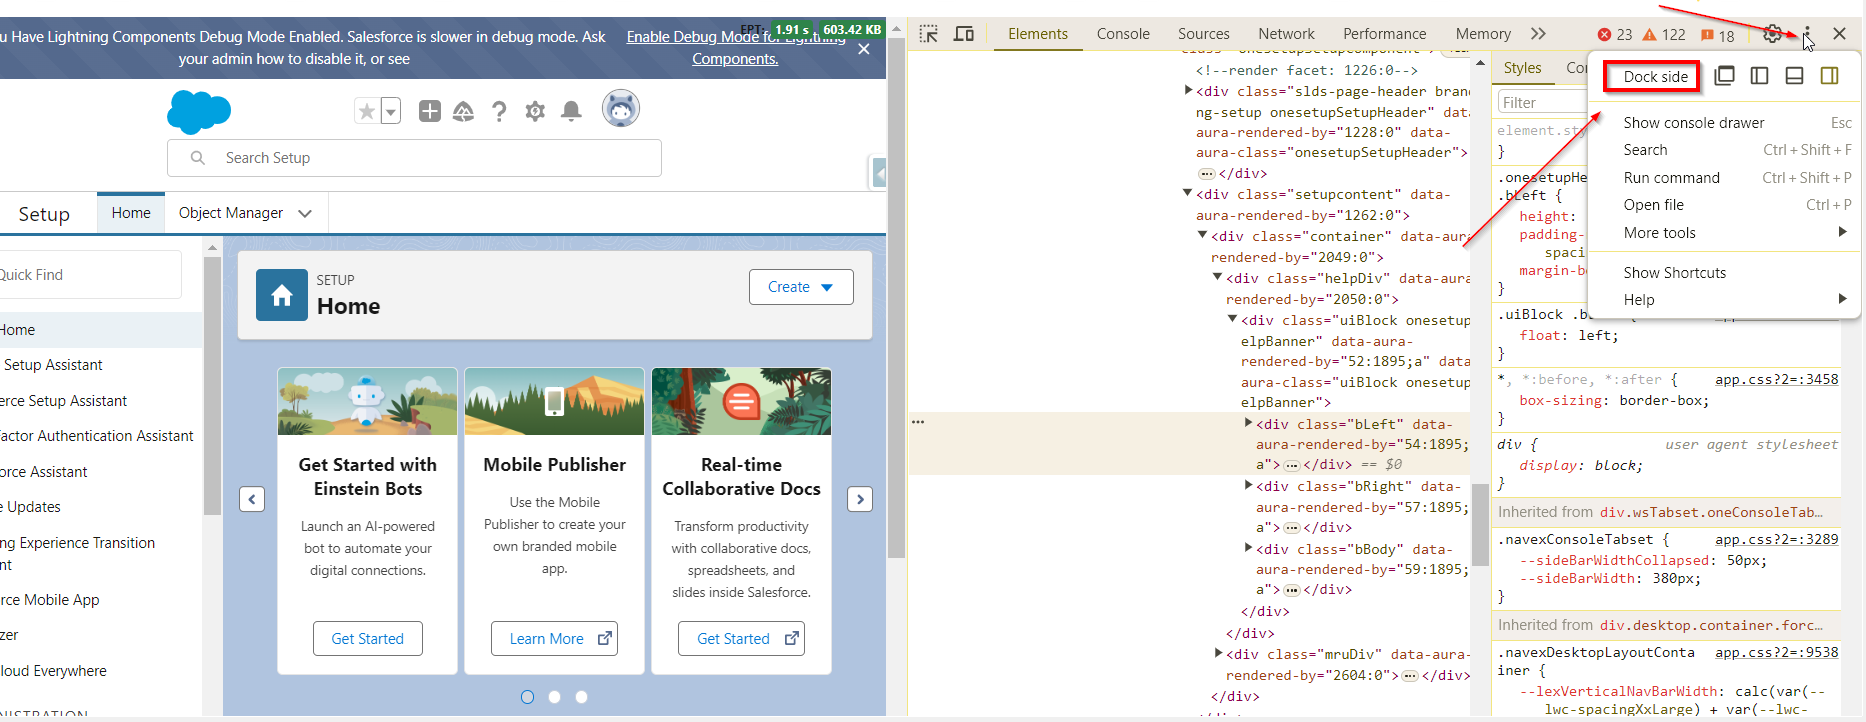
You can decide about the console position on your screen – on the left/right/bottom of your UI or in a new window. If you have two screens, I recommend having it as a separate window. For the purpose of this post, to make the illustrations more readable, I’ll have it on the right side near my page’s content.
Click the three dots on the top right corner and select Dock side.
Enable Lightning Components Debug Mode
To make use of the JavaScript debugging tools, we need to enable the Lightning Components Debug Mode for our user.
Go to Setup -> Lightning Components -> Debug Mode and select Debug Mode checkbox near your user.
Disable components caching
To prevent Salesforce from adding components to the browser cache, go to Setup -> Session Settings and uncheck the Enable secure and persistent browser caching to improve performance checkbox.
If you don’t do that, you won’t see the changes applied to the components immediately after deployment.
Ok, now we’re ready for the fun part.
LWC Developer’s everyday lifesavers – essential tools usage
Let’s imagine that you’ve been given the task to write from scratch a not-so-big component that fetches the files related to the product from the external system and displays them on the product record page.
Let’s see how Chrome Dev Tools can help you during the development.
I personally would start like this:
- Prepare the UI with the mocked version of the fetched files (can be just a table of mocked values assigned to the variable in LWC).
- Work on styling.
- Connect to the real fetch method.
Styling tools for LWC development
Let’s begin. I’ve completed a draft HTML template, prepared some CSS that seems ok, and deployed to the org.
Here’s my HTML:
<template>
<div class="attachments-listview">
<div
class="slds-var-p-vertical_small slds-var-p-horizontal_medium attachments-listview__header"
>
<span class="attachments-listview__title">
Attachments ({attachments.length})
</span>
</div>
<div
class="slds-var-p-around_small slds-is-relative attachments-listview__content-container"
>
<span
class="slds-var-p-around_small"
lwc:if={displayNoAttachmentsPanel}
>
No attachments added.
</span>
<ul class="attachments" lwc:else>
<template for:each={attachments} for:item="attachment">
<li
class="attachments__list-item"
key={attachment.documentId}
>
<c-attachment-tile
attachment={attachment}
></c-attachment-tile>
</li>
</template>
</ul>
</div>
</div>
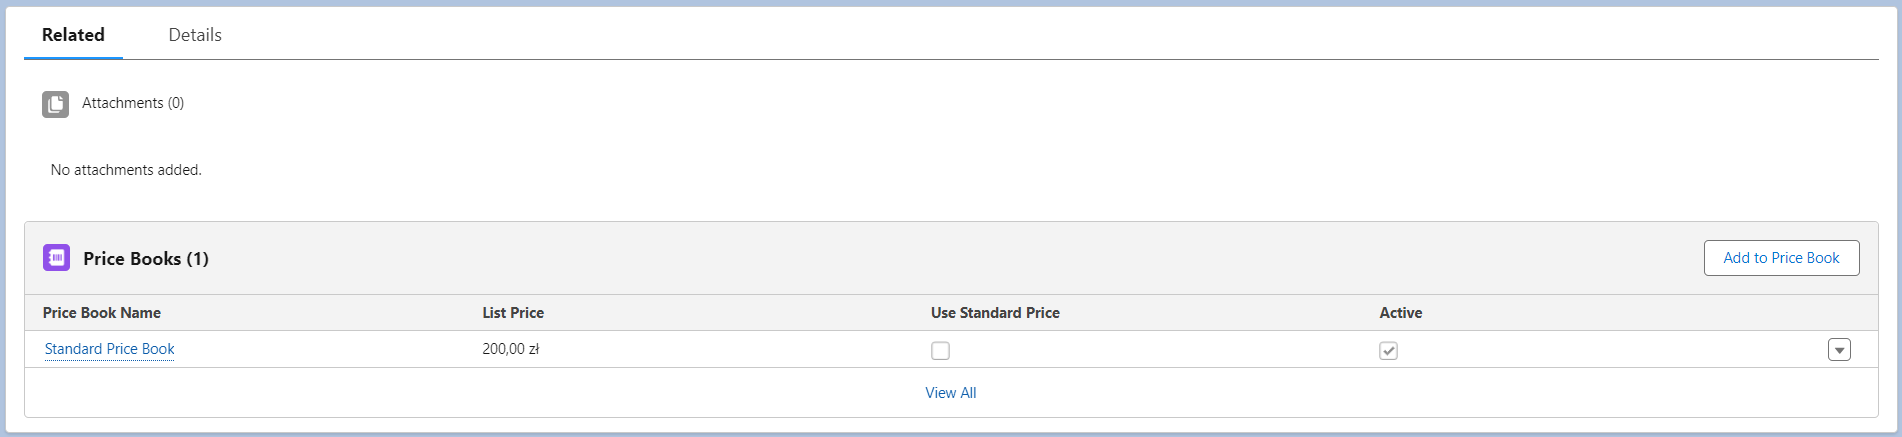
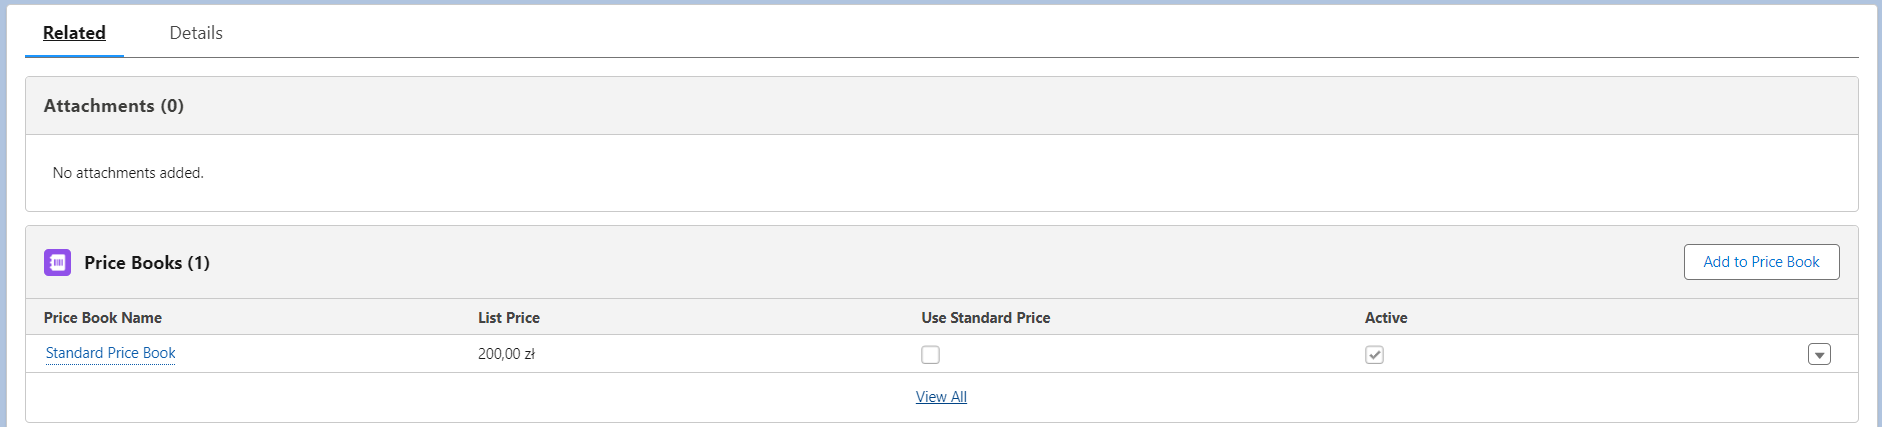
</template>The first results are not too sexy (look at the standard Price Books related list for comparison):
Let’s see how to style this monster using Chrome Dev Tools. I’m going to use the inspection tools to experiment with CSS.
CSS experimentations
When I look at the Price Books related list, I see that it has some borders. Let’s start from that.
I open the console, stay at the default Elements tab, click the inspection arrow, and find my component’s container div.
As you see, I’m able to apply different CSS styles for my elements in real time. I used the element.style rule in the Dev Tools – everything I add there, goes to the HTML element’s style property.
I can also add styles to my existing classes (e.g. _attachments-listview_header), but bear in mind that all of those newly added styles will be gone when I refresh the screen. Make sure to copy them to your component and deploy them once you’re satisfied with the results.
Below, you can see how I experiment with the align-items flex-box property applied to my CSS class to position the component’s title nicely. I don’t have to necessarily remember all the options – I can select them from the picklist and see if I like the results in real time.
Ok, this looks better now, but still – not too well.
Note: if you open the inspection tool, you might see the JavaScript console at the bottom. You can toggle its visibility by pressing Esc or going to more (three dots in the top right corner) -> show console drawer.
Color eye dropper
Let’s use the color eye dropper tool to adjust the colors. I click on the color icon next to my border style and choose the magic wand near the palette. Now I can click on any element on the page and the color will be copied and applied to my style. I’ll do the same for the background of the component’s header.
Nice! I’m not ashamed anymore, this starts to look neat. I see that the header’s title still doesn’t look exactly as it should.
Copying styles from other websites or components
I’m not going to guess and write this from scratch – let’s copy the styles of the Price Books component’s header title. Let’s click "inspect" on it and see what we can reuse.
Adding or removing css classes on the fly
You could have noticed that the Price Books header styles that I copied were all part of one class – _slds-card_header-title. Instead of copying the individual styles, I could just add the class to my element (which would be a cleaner approach). Let’s do that.

As you can see, I can both add and remove the classes from elements to see how it affects the final look. It can be useful to identify unneeded classes or to add the necessary ones instead of writing your own, custom ones.
This is exactly my case there – when I remove the _.attachments-listviewtitle class, I don’t see any difference anymore (.slds-cardheader-title_ takes care of everything). I’m free to remove this from my custom CSS.
Changing element content
There might be a case when you’d like to check how your component behaves when the displayed text is very long. Apart from adjusting your test data (in our case: files fetched from the external system), you can inspect the element and change its inner text by double-clicking it.
Toggle element state
Sometimes you need to check the styles of a certain component when it is focused/pressed/hovered, etc. There is a special option for that in Chrome Dev Tools. Inspect the desired element and click :hov button.
Let’s see it in the example of the "Add to Pricebook" button visible under our component. Observe how the appearance of the button changes when I click different state options – the styles listed on the styles panel change as well.
Simulate mobile device view
There is also a feature that allows you to check how the component would look on the mobile device (or generally, the device with a different screen resolution). Click Inspect and Toggle device toolbar.
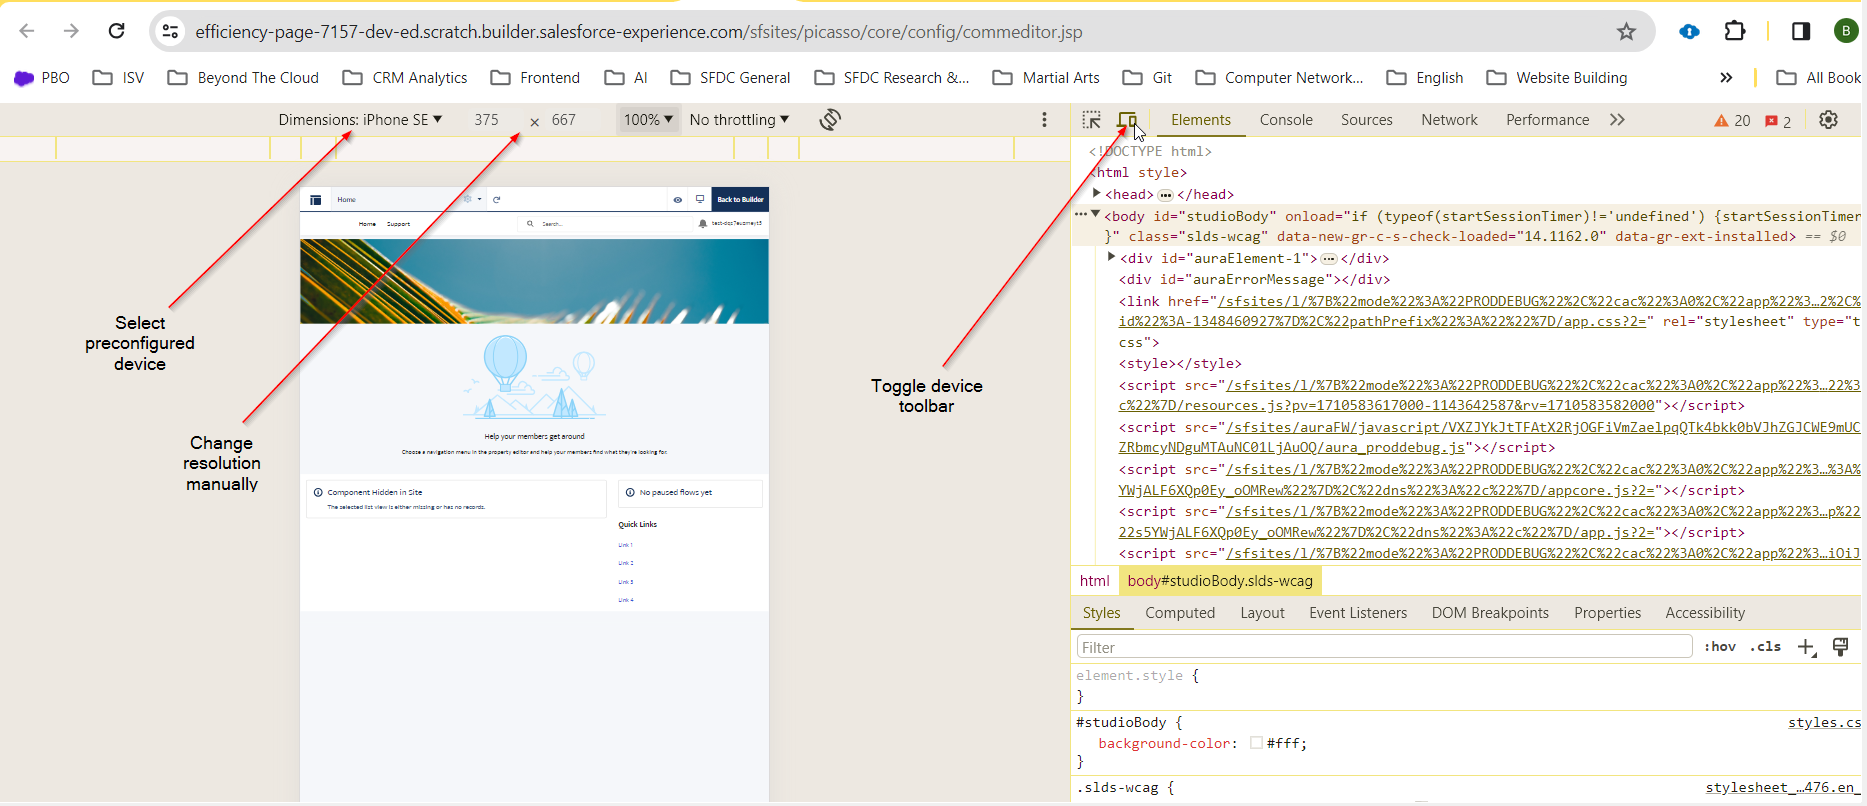
Unfortunately, this isn’t useful for the components placed in internal Salesforce org – when you toggle the device type, UI automatically changes to Salesforce Classic (Lightning Experience is not supported in modal devices accessing it from Chrome browser – you’ll need to test using the mobile app).
However, it’s still a great option for external sites, be it Experience Cloud or non-Salesforce technology that you want to integrate.
Styling – summary
We covered the most crucial styling tools. Our component looks nice. Before connecting it to the real file data, let’s see the full experimentation process in the Chrome Developer Console and summarize the stuff we’ve seen.
Chrome Dev Tools styling use cases we covered:
- CSS inspection and modifications – you can inspect the DOM and current styles of the components, as well as try out different new styles on the fly.
- Color eye dropper – if you want your element to have the same color as the other that you see on the page, you can easily copy it by just clicking on the already-colored component.
- Copying styles – if you like some other component’s styling, you can inspect it, copy it to your own component, and make adjustments directly in the Chrome Developer Console. Once it looks good, you move those styles to the real code that you deploy.
- Toggling CSS classes – we can add and remove classes of the elements to see how it affects the final look & feel – all real-time without constant redeployments.
- Changing elements’ inner content – to check how the component would look like with different content (e.g. much longer text), you can modify it on the fly and see the results, without the real update to the actual data from the org.
Javascript debugging for LWC development & troubleshooting – better than console.log
I’m going to remove the mocked files array and start using a real controller method to get the files. We won’t dig into the details of the Apex controller’s logic, we will focus on the JavaScript part.
Here’s the code that I’m starting with:
import { LightningElement, api, track, wire } from 'lwc';
import getRelatedFiles from '@salesforce/apex/AttachmentsRelatedListController.getRelatedFiles';

export default class AttachmentsRelatedList extends LightningElement {
    @api recordId;
    @track attachments = [];

    @wire(getRelatedFiles, { recordId: '$recordId' })
    fetchAttachments({ data, error}) {
        if (data) {
            this.attachments = data;
        } else if (error) {
            this.attachments = [];
            console.error(error);
        }
    }

    get displayNoAttachmentsPanel() {
        return this.attachments.length === 0;
    }
}
This code looks nice, but for some reason, I keep seeing the no-attachments-added version of my component.
Let’s debug that!
Breakpoints
We can set up breakpoints in our code to see how it executes and what are the variables values line by line. There are two main ways to achieve that in LWC.
Set breakpoints on Chrome Developer Console level
This is the most clean approach. Let’s open the Chrome dev tools and go to the Sources tab. On the left panel, we see the modules/c subfolder that contains our components.
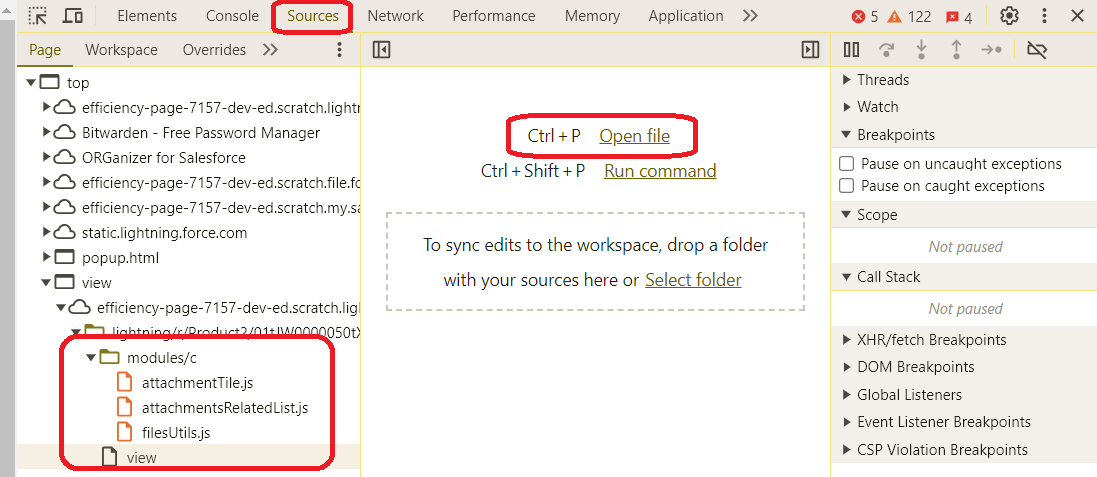
If this is collapsed, we don’t have to search for it – we can use the ctrl/cmd + P combination and start typing the component’s name (you’ll see two files with your component’s name – be sure to select the one located in the modules/c folder).
We see our component’s code together with the LWC framework auto-generated stuff. Let’s create a breakpoint in the fetchAttachments wired method to see what actually comes to the component from the backend method.
For that, let’s just click on the desired line number. That’s it. The breakpoint is created. Now, when I refresh the screen, the execution will stop at this line.
Set breakpoint using debugger keyword
You can achieve a similar result by putting the debugger statement in your code on the desired line in the component
@wire(getRelatedFiles, { recordId: '$recordId' })
    fetchAttachments({ data, error}) {
        debugger;
        if (data) {
            this.attachments = data;
        } else if (error) {
            this.attachments = [];
            console.error(error);
        }
    }
This is less convenient and less clean – you have to remember to remove all those statements before committing the code.
Get rid of Proxies in the debugger
Let’s continue debugging – I’m refreshing the screen and the execution stops in my wired method. However, when I hover over the data variable name, I see a Proxy instead of the array of files.
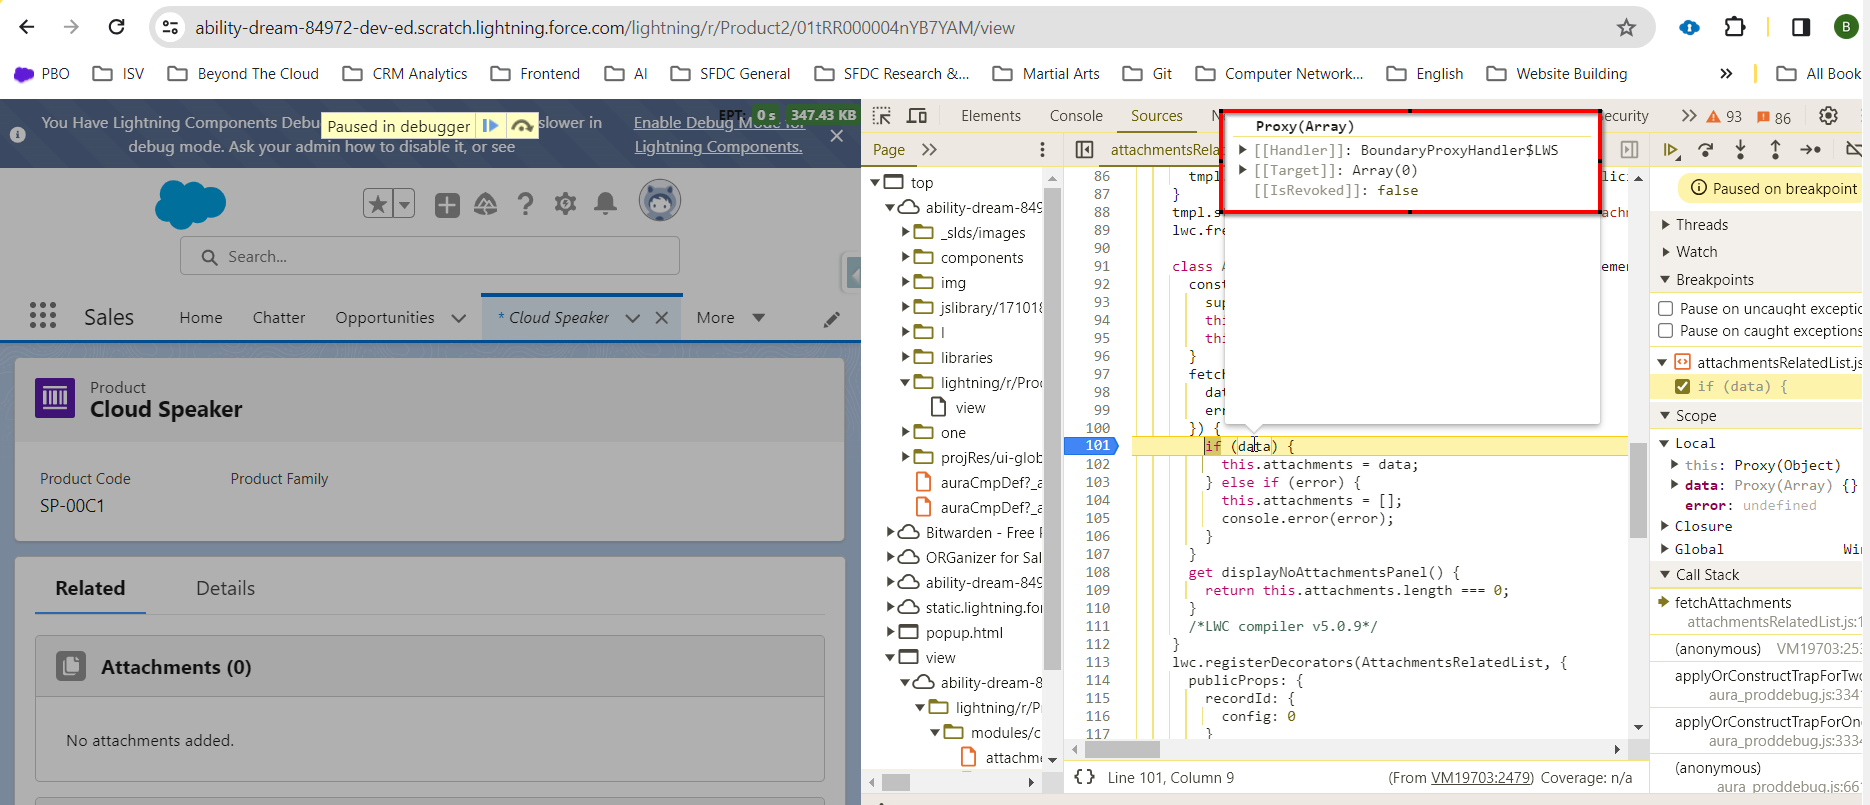
That’s because the LWC framework automatically wraps some vars with JavaScript proxies, e.g. to make them read-only (I won’t go into details of proxies now. If you want to read more, reference this and this article).
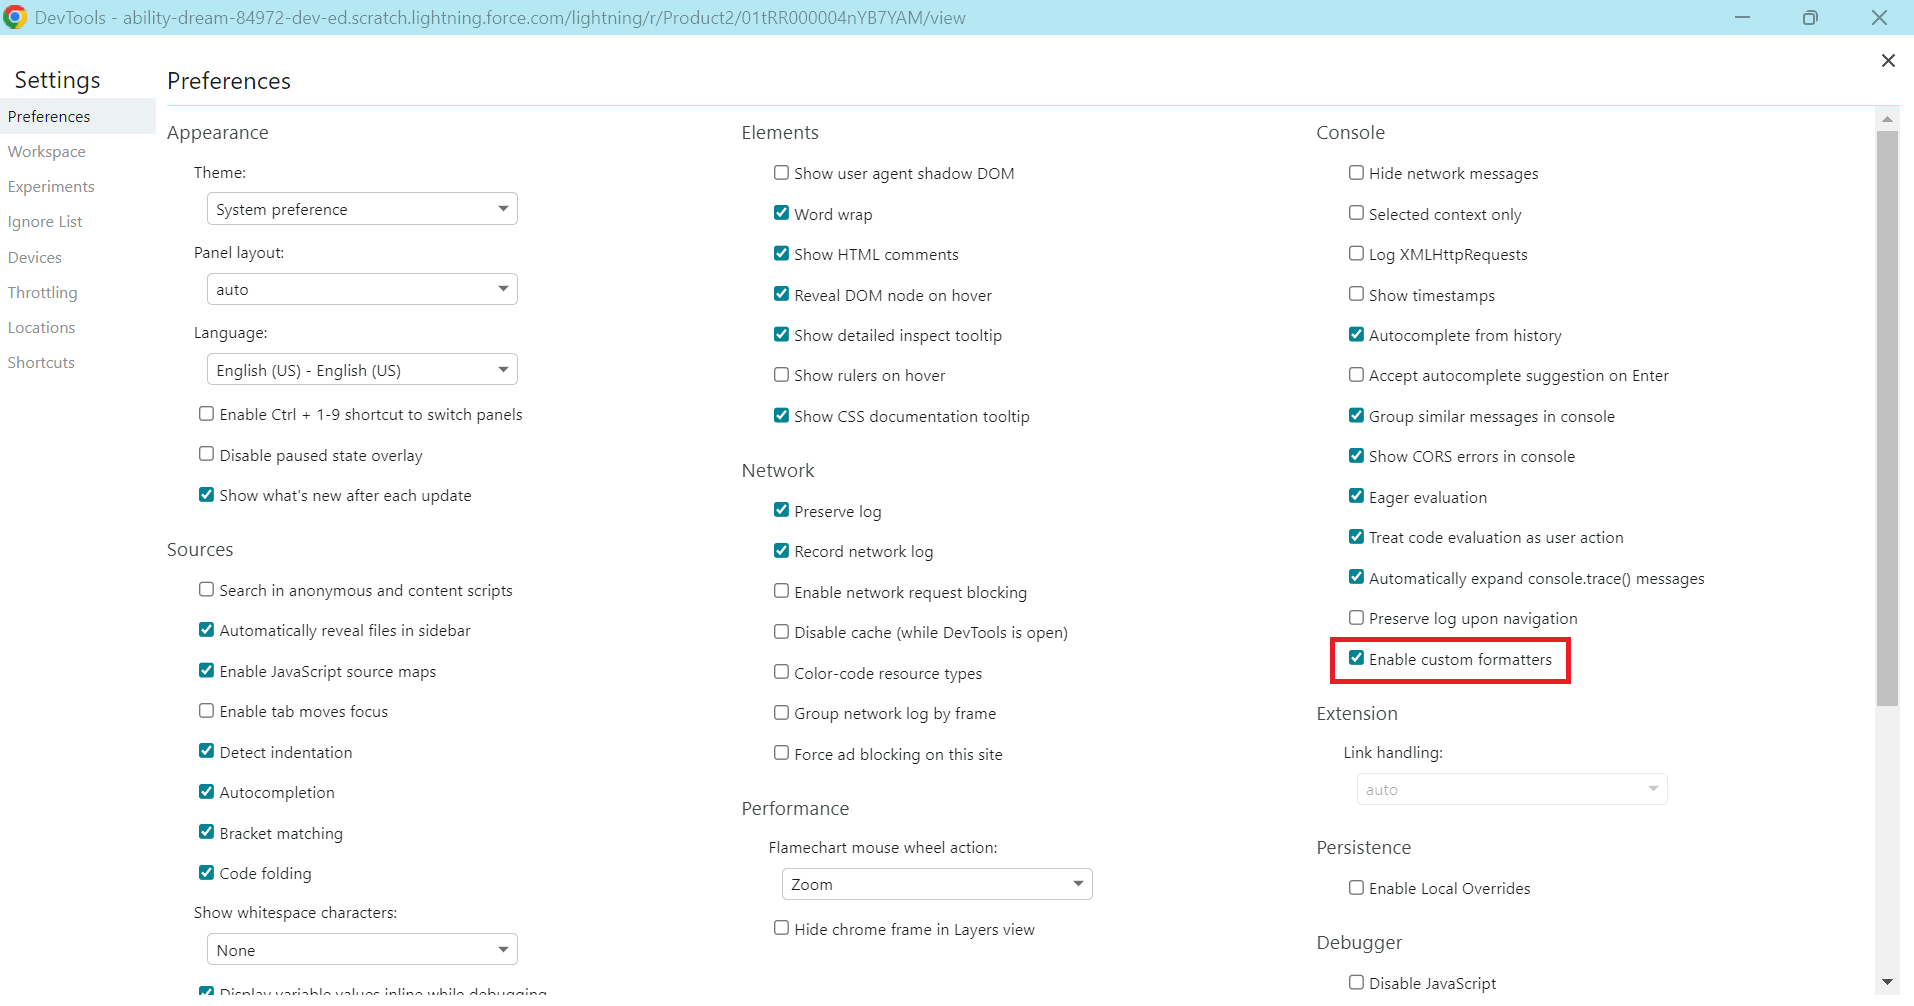
To see your variables correctly, Salesforce recommends enabling custom formatters in your Chrome Developer Console.
Let’s open the console F12 -> Settings -> Preferences and check the "Enable custom formatters" option under the "Console" section.
However, at the moment of writing this post, this doesn’t work when you have Lightning Web Security enabled on your org (it is enabled by default). We have two options there:
- Disable LWS for the time of debugging and reenable it afterward (be sure to test your component after reenablement!). Go to
Setup -> Session Settings -> Use Lightning Web Security for Lightning web components and Aura componentsand uncheck the checkbox. Clear your cache to make sure that this is reflected immediately. - Instead of hovering over the variable to see its value (that’s where you see the Proxy instead of the value), print it in the console with
console.logwhile the execution is stopped by the debugger. Note: don’t just type the variable name in the console – it will print the proxied version. Use the console.log method.
I’m going to use the first approach.
Note: if you enabled custom formatters, disabled the LWS and you still see proxied variables, empty your cache (see Empty cache & hard reload section of this post).
Navigating through code in the debugger
Once we’re in the debugger and stopped at the specific line, it would be cool to see how the program executes line by line. There is a dedicated panel in the Chrome Developer Console for such a need.
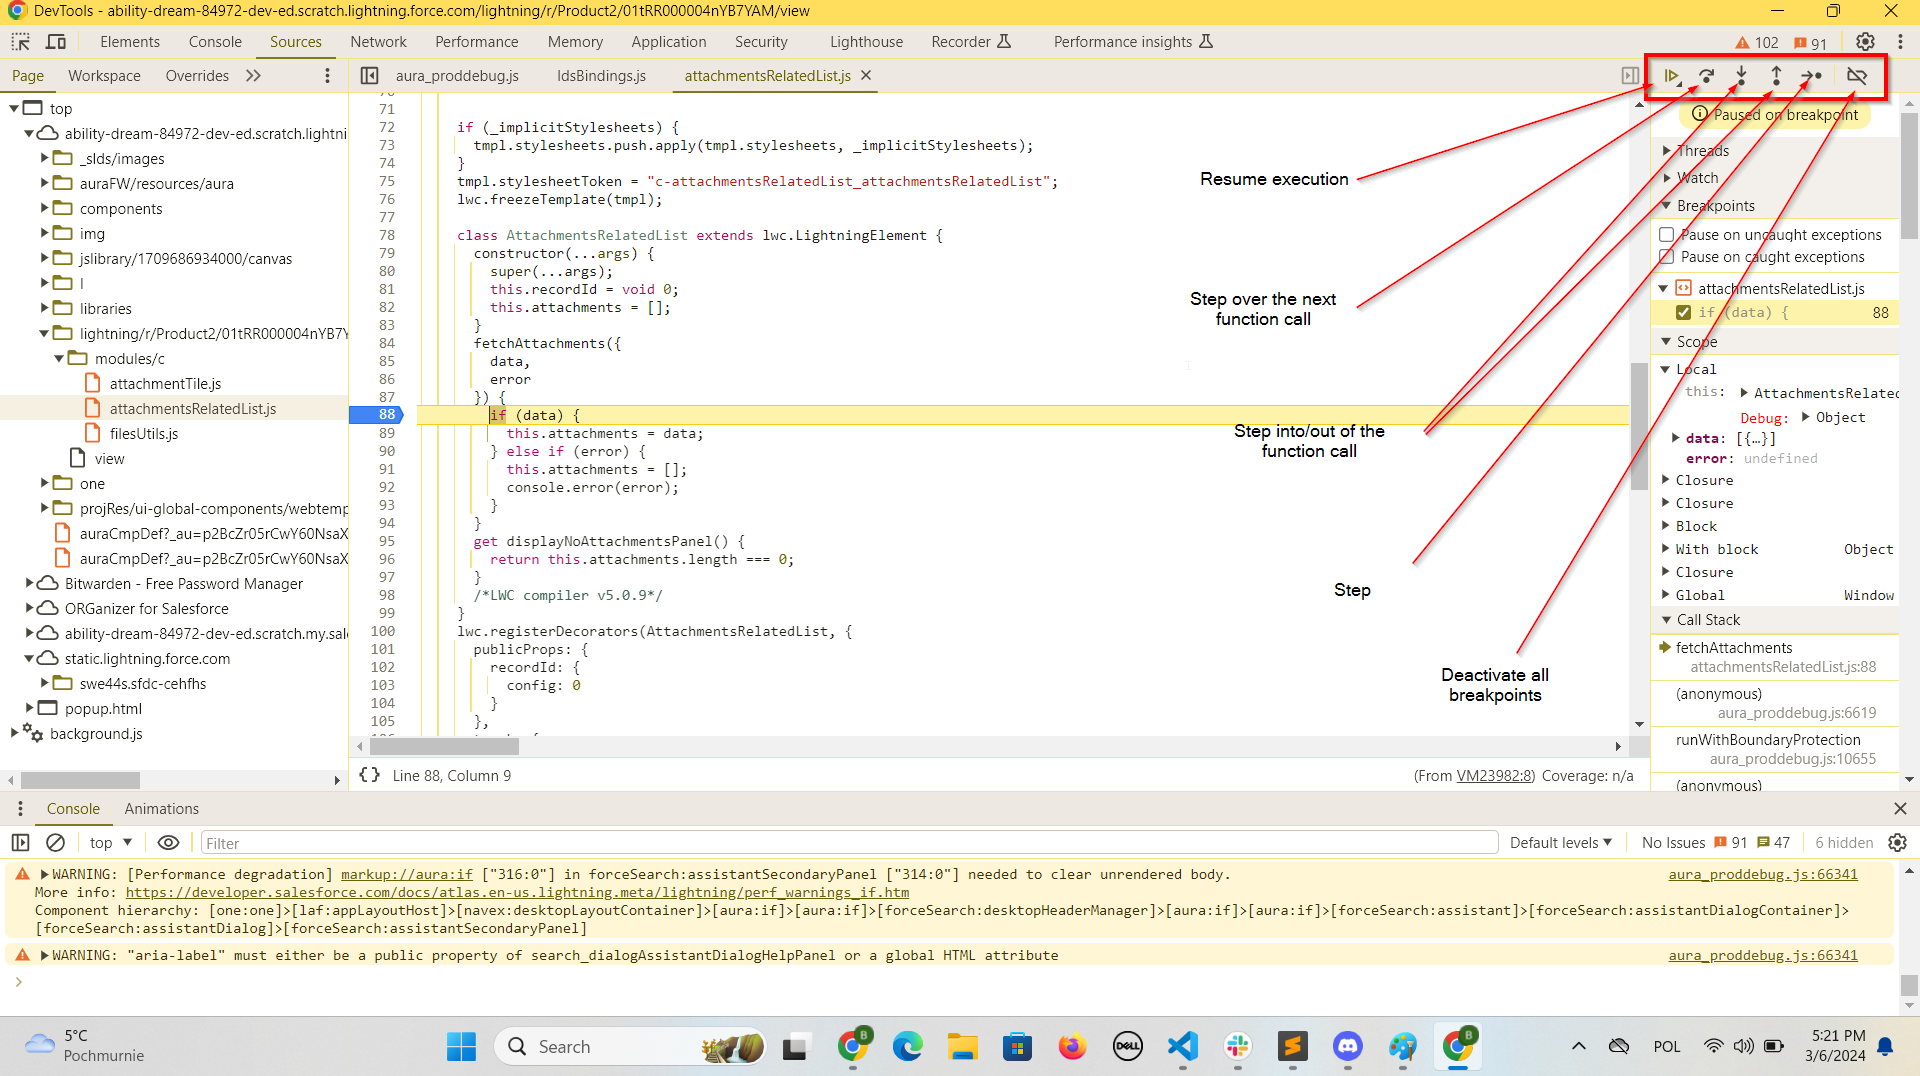
Let’s talk briefly about each option:
- Resume execution – as the name suggests, it resumes JavaScript execution. If you have more breakpoints, the program will stop at the next one.
- Step over the next function call – goes to the next line; if the next instruction is a function execution, does not step into it to execute it line by line – executes it as a one call.
- Step into the function call – goes to the next line; if the next instruction is a function execution, steps into it to execute it line by line.
- Step out of the function call – goes back from the nested function.
- Step – same as the Step into the function call, but handles async function execution differently – it pauses at each line in the order as they are executed. Step into the function call pauses in the order of lines as they are written – if it encounters the async function call (e.g.
setTimeout), the execution isn’t stopped until the async function body is finally executed (reference this thread to understand it better). - Deactivate all breakpoints – toggles the activation of all the breakpoints you defined. Very useful if you have a large component, you placed multiple breakpoints and you want to test it without any pauses. If the test shows you that the debugging is still needed, you just click the same button to reactivate your breakpoints.
In practice, for LWC debugging, you’ll use Resume execution, Step over the next function call, and Deactivate all breakpoints most of the time. Stepping into/out of the functions would be inconvenient as it would also step into the framework’s under-the-hood logic (e.g. mutation observers tracking changes to your reactive props).
Let’s see this in action:
In our example, this is more than enough to see that we receive an empty array from the fetchAttachments method call – we know that the issue is on the backend controller’s side.
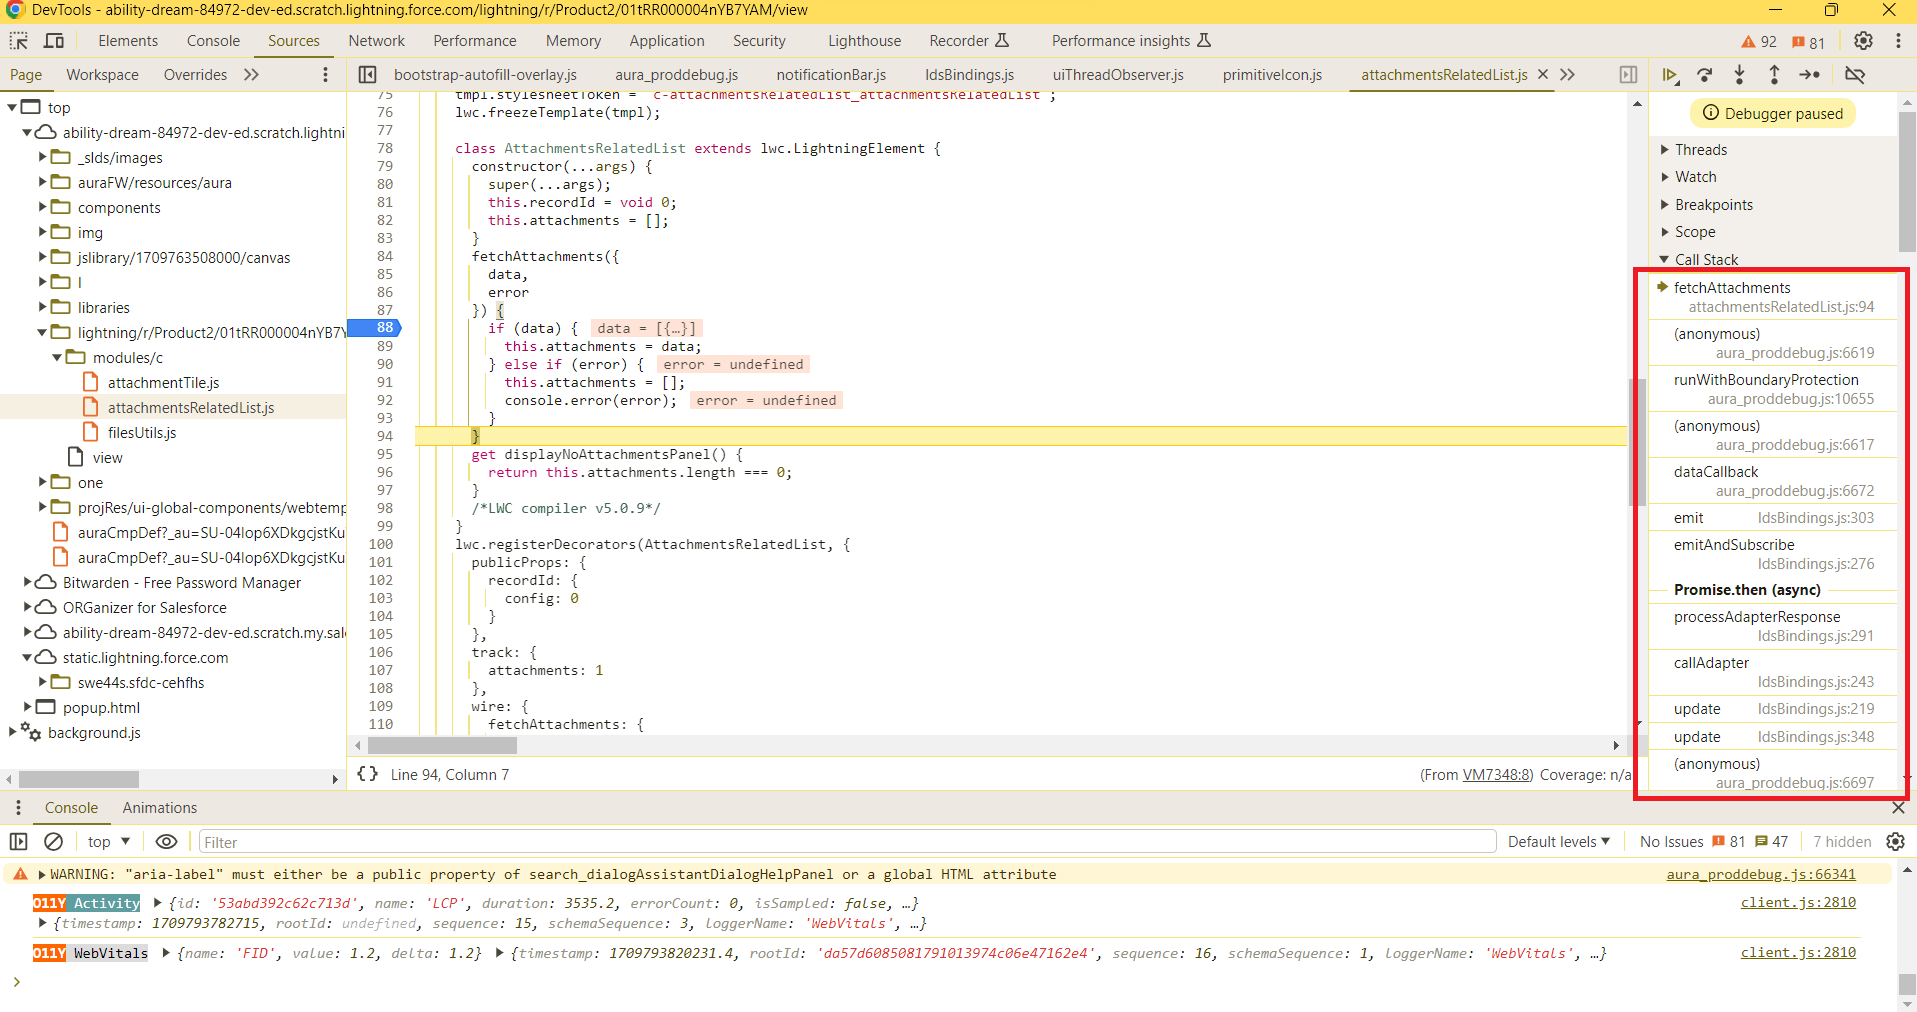
Execution stack
You might have noticed that as you go through the code in the debugger, some content is shown in the Call Stack panel – this is a place where all function executions are logged. Unfortunately, this isn’t actually very useful in the context of LWC, because it shows many calls executed by the framework under the hood.
Conditional breakpoints
If you have some experience with LWC and wired adapters, you know that the wired method always executes twice – the first time both the data and error properties are undefined.
Let’s create a condition on our breakpoint so that we pause only on the executions when either error or data is populated.
We can right-click on the breakpoint, select "Edit breakpoint" and specify the condition.
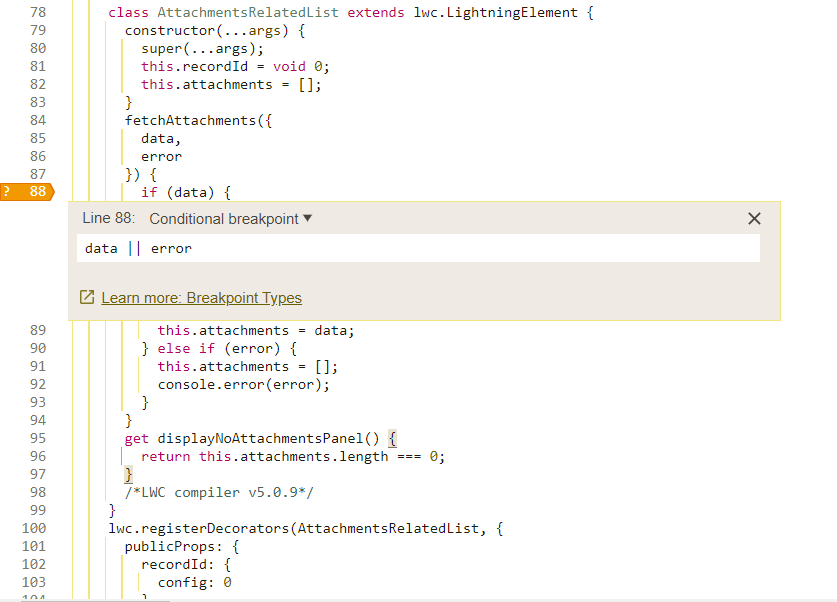
Nice! This can be very useful in many cases when you don’t want to pause every time some function is called.
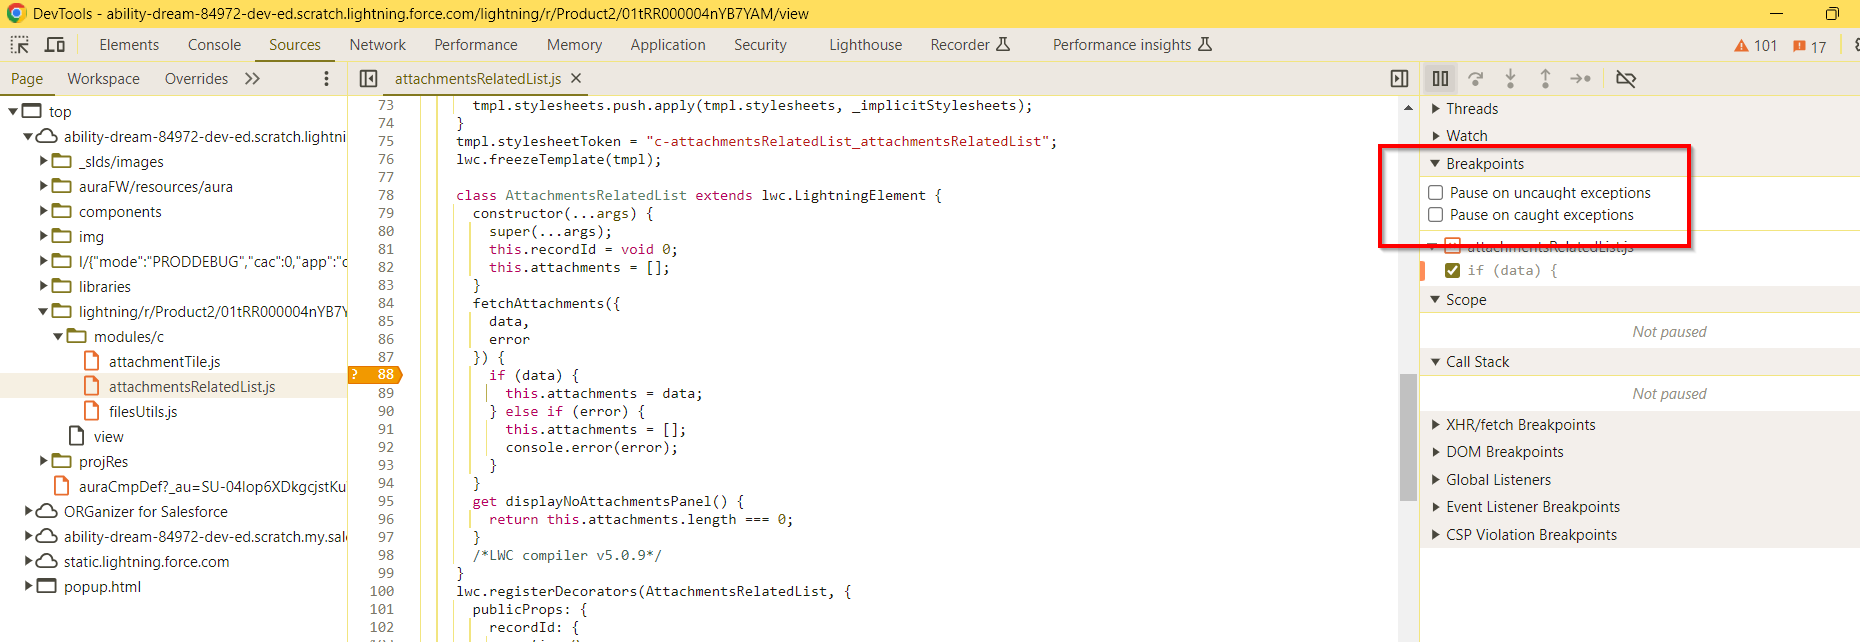
Pause on exceptions
When we deal with more complicated components, we might encounter JavaScript errors thrown by our code, that are difficult to troubleshoot. For such scenarios, there is a dedicated Pause on exceptions feature. When enabled, the execution stops at the line that throws the error, and we are able to check the current state of variables (only variables that are in the current scope, of course).
Depending on your choice, it will act like that either for only uncaught exceptions or for every exception thrown (even if you have a try…catch block).
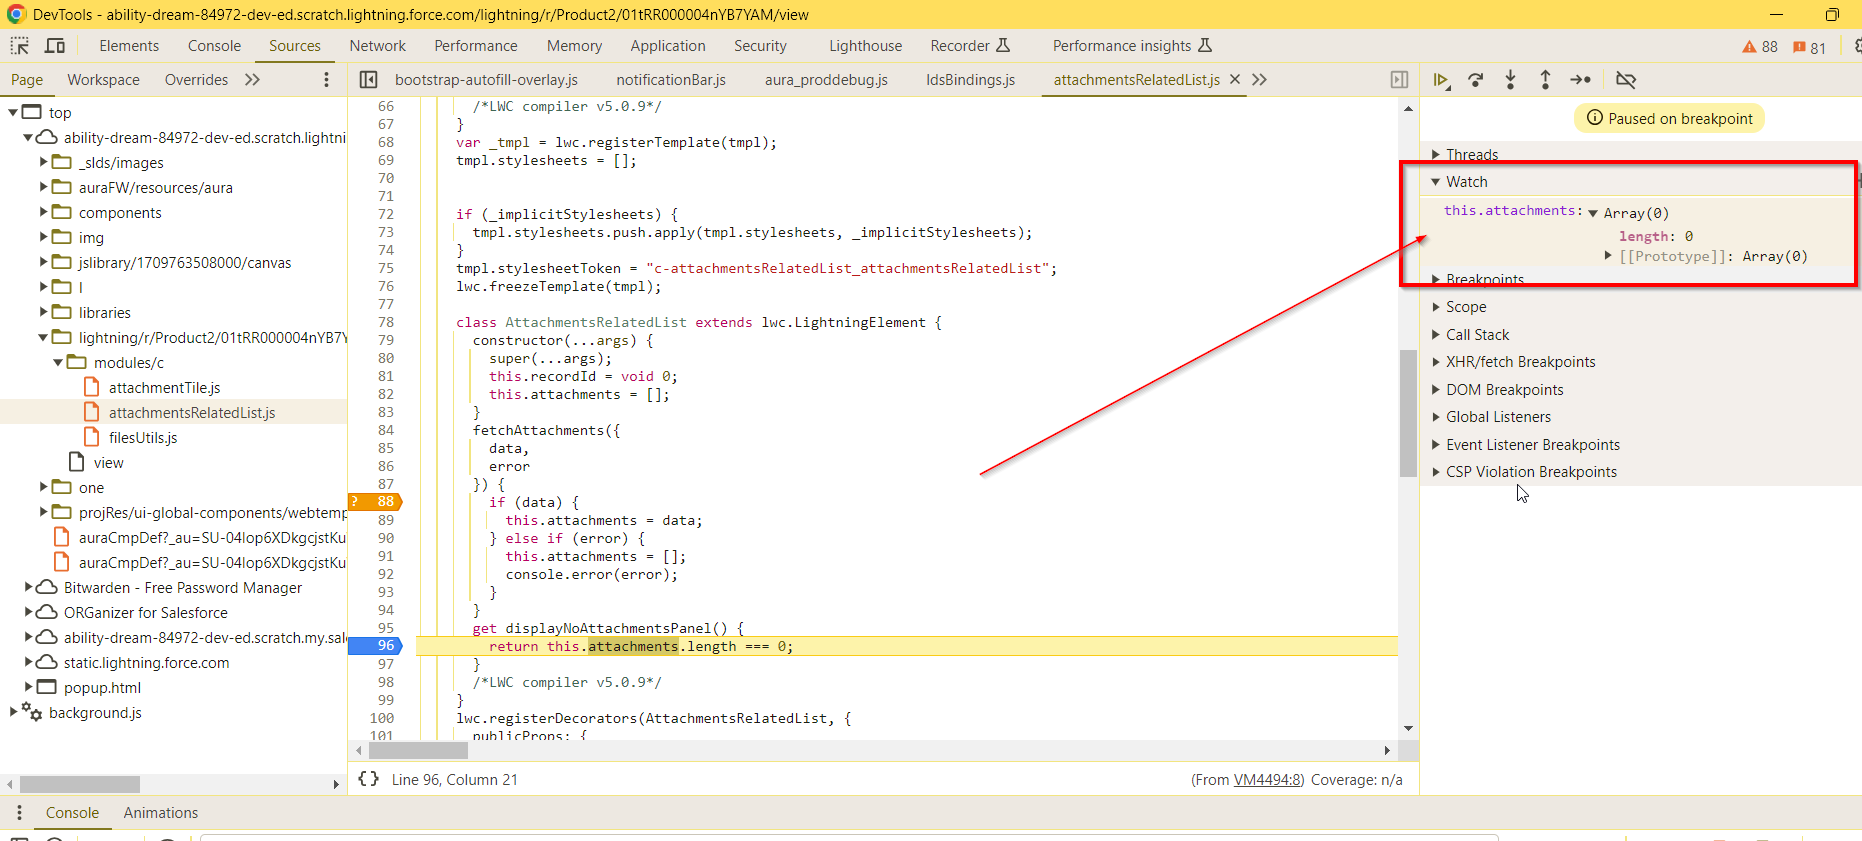
Variables watch
There are situations when your component has multiple methods, you’ve set up multiple breakpoints and you need to check the value of some specific variable after every single line execution. Printing it into the console, or even hovering over it every time can be annoying (especially if you want to observe more than one var).
Luckily, there is a watch feature that has you covered. You can type the variable name there, and Chrome will show you its up-to-date value every time the debugger pauses at some line.
Let’s see this in action. I will set an additional breakpoint on our displayNoAttachmentsPanel getter and add this.attachments variable to the watch section.
Now I’m able to observe this.attachments on every debugger pause:
Old good console.log
Of course, instead of using debugger, you can use console.log for simple cases. It will just print whatever you want into the Chrome console.
Styling console.logs
Logging a message is too simple to show as an example here, but there is one thing that some devs might not be aware of – you can style the logged messages very easily. Although this is not related strictly to the Chrome Dev Tools, let’s have it here as a little bonus.
To add styling to your console message, just prepend it with %c and pass the CSS style string as a second parameter (you can also use multiple %c and pass multiple styles for different parts of the message).
For example, the below code:
displayLowPerformanceWarning() {
    console.warn(
        '%cThe component is running slowly.',
        'font-size: 16px; color: white; background-color: red;  border: 1px solid black;'
    );
}
would result in such a message in the console:
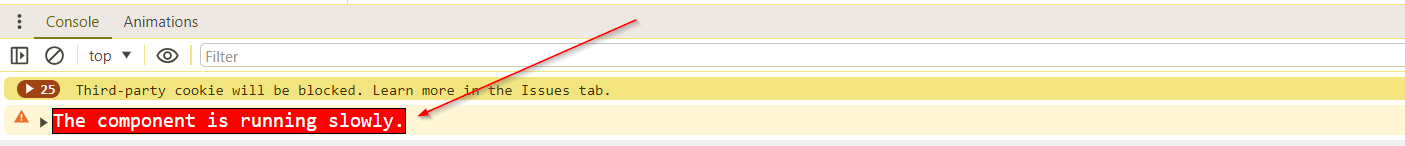
To learn more about this feature, check out the official documentation.
Empty cache & hard reload
There is an option on Chrome Dev Tools to empty the cache very quickly. I think I don’t need to explain why this is useful. Open the Chrome Developer Console (it must be opened to enable the option) and right-click on the page refresh button. Click Empty Cache and Hard Reload.
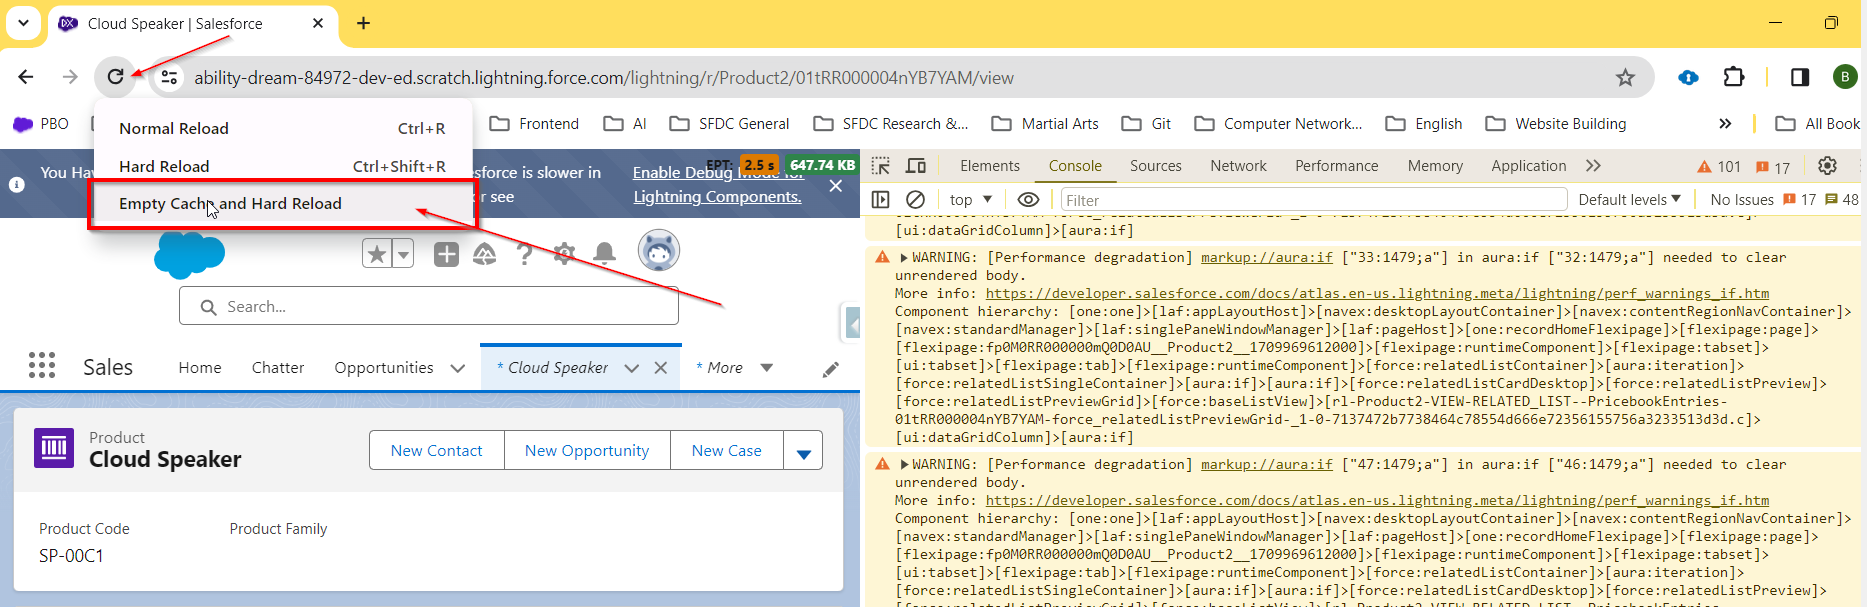
What is happening in the background? Chrome clears the cache for the page you’re currently on and performs a hard reload (that forces the browser to load the fresh version of the page from the server – without even looking at the cache).
If you need more powerful options to reset the state of the page, e.g. clearing also the local storage, removing saved passwords, or emptying the form data, there are Chrome extensions that you can use. One of them is Clear cache. Check this link to check it out.
Javascript debugging – summary
Ok, I think that is fairly enough for the foundation. As you’ve seen, Chrome Dev Tools make JavaScript debugging much easier.
The summary of what we covered in this section:
- Breakpoints – you can set breakpoints anywhere in your code to see the state of the component at a specific time. You can set them directly in the Chrome Developer Console or use the
debuggerkeyword. - Navigation through code – after pausing on the breakpoint, you can go through the code line by line and step into specific functions. For complex components, inspecting the execution stack might also be helpful.
- Breakpoints deactivation – you can temporarily deactivate all your breakpoints to check if the code already works. You reactivate them with one click.
- Conditional breakpoints – you’re able to specify a condition at which the execution will stop at a specific location.
- Pausing on exceptions – you can pause at exceptions and see the component state just before they are raised.
- Observing variables – by using the watch capability, we can constantly monitor the state of multiple most important variables.
- Logging – if you want, you can use the
consolemethod to log messages in the console. You’re able to style and format them. - Clearing cache – you can clear the current page’s cache very quickly by using the Empty cache & hard reload feature.
Network monitoring
There is a separate tab in the Chrome Developer Console dedicated to network monitoring – it lets you see what data is actually sent and received by your page. It is very useful when you integrate with third-party services or prepare a custom authorization solution – you can check what were the actual body and headers of the request sent to the external server, and what it returned.
For our attachmentsRelatedList component load example, it looks like this:
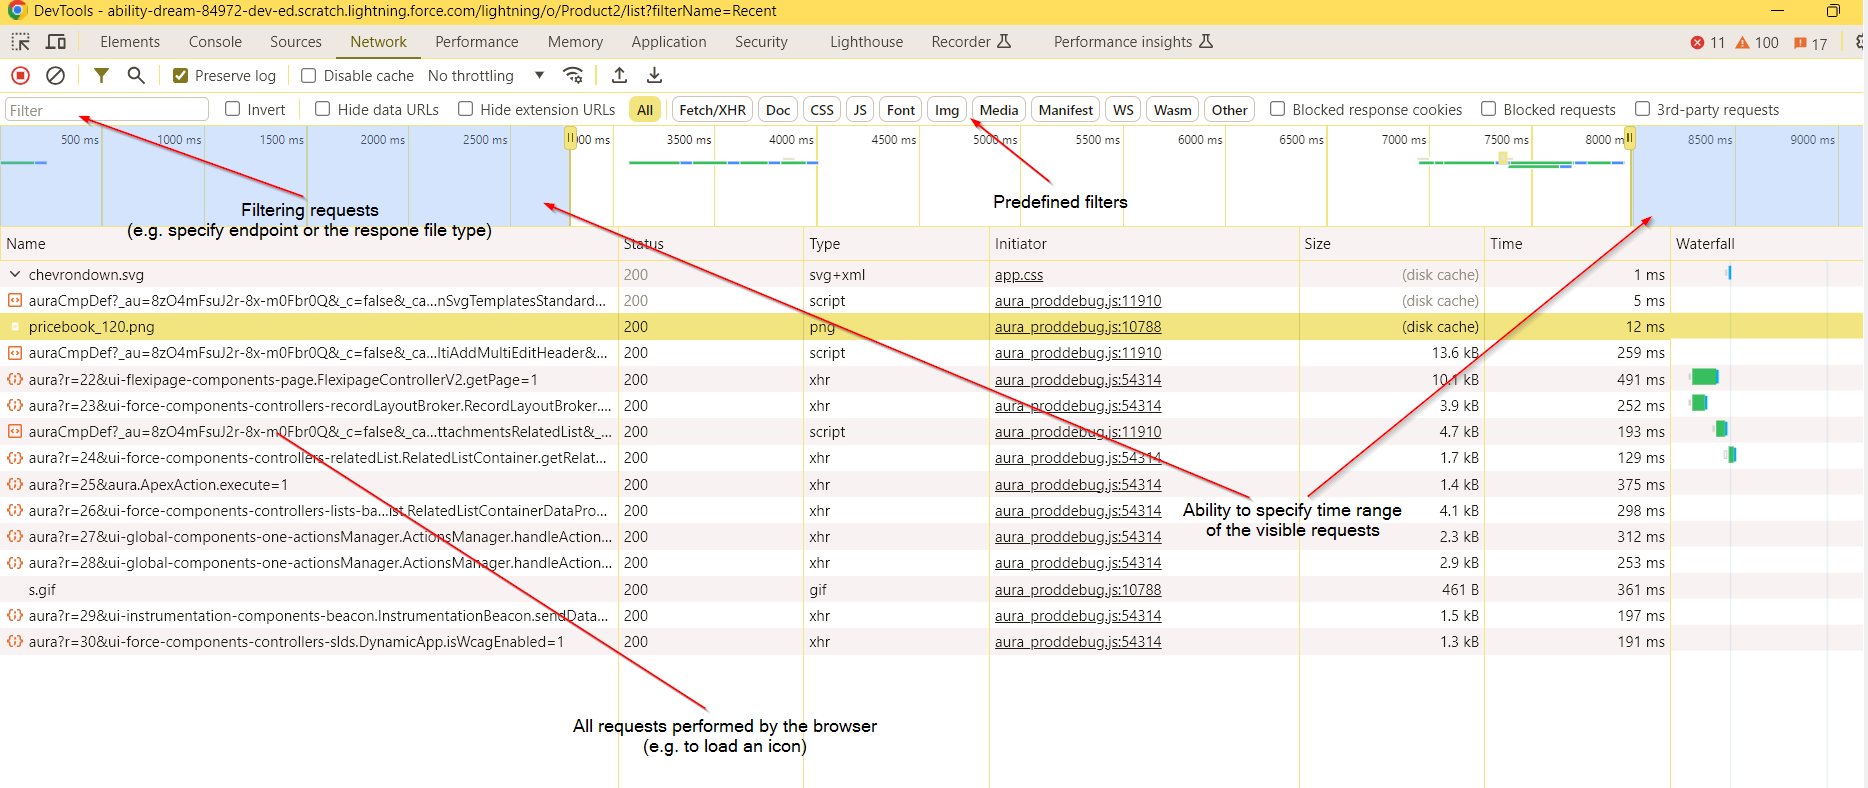
As you can see, it contains all the requests (together with the responses) performed by the browser since I reloaded the page with my components.
Note that it records the network activity only when you have Chrome Developer Console open – if you open it during the page load, some requests will not be shown.
You can select any of the requests and see their details together with the response details:
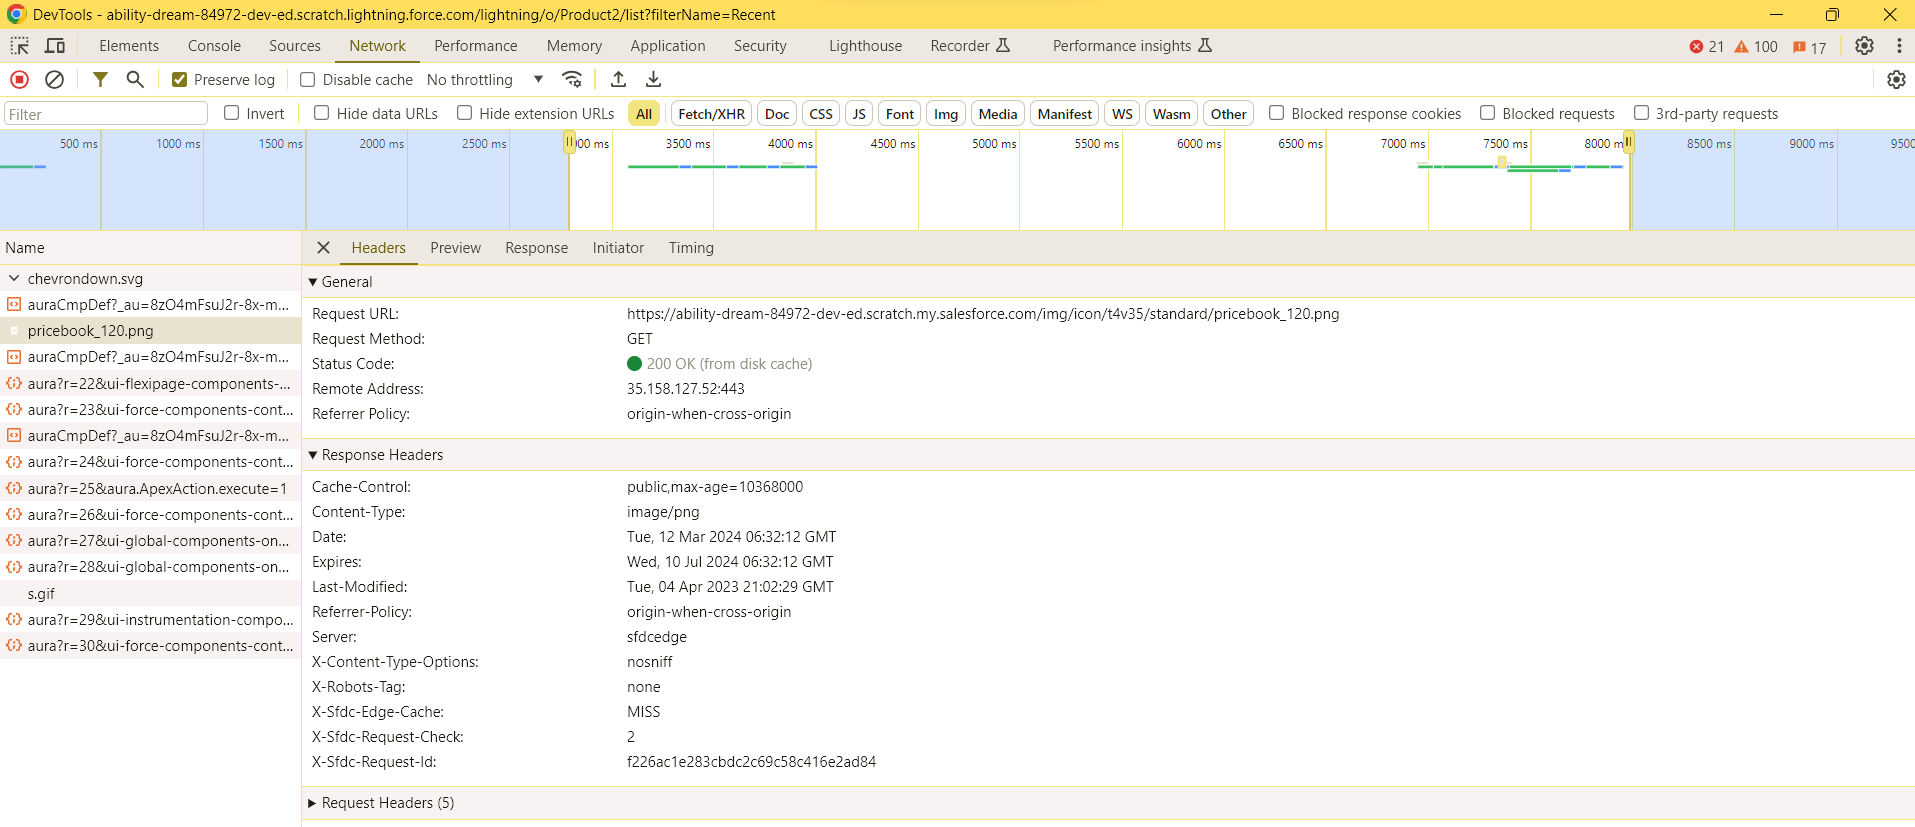
There are a few more powerful things that you can do with the Network tab, but for the day-to-day LWC Developer’s life usage, this is more than enough. If you want to learn about more use cases and features, reference this official guide.
Browser storage
The Application tab allows you to check the data locally stored by your browser for different domains. The items that you might want to inspect/delete frequently are:
- Local storage (data persisted via the Web Storage API in the cross-session context)
- Session storage (data persisted via the Web Storage API in the session context)
- Cookies (cookies set by different domains)

Essential tools – conclusion
Those were the most important aspects of the Chrome Dev Tools usage for the LWC Developer. If you apply them to your everyday frontend routine, I’m sure you’ll get much much more productive.
However, this obviously doesn’t exhaust the topic. As I’m not going to copy the whole Chrome Dev Tools documentation here, I’ll just give you a reference to it here, so you can explore it yourself. Enjoy!
Chrome Dev Tools – tips & tricks for LWC
If you’ve already known all the stuff I covered so far, fear not, this is the section where you’ll see something new!
I will show you less known and very useful tricks of Chrome Dev Tools that you can apply immediately.
Let’s get started!
Document design mode
Ok, if you haven’t heard of the design mode before and you’re standing now, sit down.
When you enable this mode, you can change the inner text of the elements on the page. Just type document.designMode = 'on'; in the console. I’m not going to write too much, just see this in action:
This is suuper useful if you need to send a screenshot of a PoC (Proof of Concept) of not fully ready functionality or want to quickly gather feedback from the customer.
BTW. have you ever wondered if all the screenshots of bank transfers "I sold this app for 500k, look at this proof" are trustworthy? Maybe they were slightly modified using the design mode? Just asking…
Code snippets
Had situations when you wanted to experiment with JavaScript or execute the same piece of code in the console multiple times? Check out the Snippets feature. As the name suggests, it allows you to save a JavaScript snippet in your browser and execute it anytime you wish. Open the console, go to Sources -> More tabs -> Snippets, and create your reusable snippet.
Changing color format
It’s sometimes frustrating to convert tens of color styles written in RGB to the hex format or vice-versa. When you see some color style in Chrome Dev Tools, you can press Shift and left-click on the color icon to toggle its format.
Local overrides
You can override the JavaScript of any website with your local changes. This is very useful when you want to test the component’s behaviour without deploying the code, or if you are not yet allowed to deploy, but need to somehow figure out the bug fix. Or you can’t create records on prod but need to do a smoke test.
Open Chrome Dev Tools, go to Sources -> Overrides, and click "Select folder for overrides".
You’ll be prompted to select a folder on your local machine – this is where the overrides will be saved (you don’t need to place any data here, any override you create using Chrome Dev Tools will be saved here). After the catalog selection, open the file that you want to override in the Chrome Dev Tools Sources tab, apply the changes, and save.
Let’s see it on the attachmentsRelatedList component example. I will override the attachments assignment so that a mock array is used instead of the data returned by the controller’s method.
This feature has other powerful options, such as requests responses overriding in the Network tab (note: this won’t work for apex method invocations, but can be useful for external callouts from js). If you want to learn more, reference the official documentation here.
Note: if you looked at the official docs, you might think that the styles of LWC could also be overriden this way – that’s not the case as the framework places them in the HTML DOM – its elements are not supported by Chrome overrides.
Capture specific element screenshot
You can take a screenshot of the specific HTML node directly from the Chrome Dev Console.
Select the element via the inspection tool, press Ctrl+Shift+P (Windows/Linux) or Cmd+Shift+P (Mac), and select capture node screenshot.
You can also achieve that by right-clicking the element and selecting capture node screenshot from the context menu.
As you might have noticed, you also have the option to capture the full page or a specific area screenshot.
Simulate slower internet – throttle network speed
You can test how your components behave for users with slower internet connection.
Go to the Network tab and click on the throttling picklist.
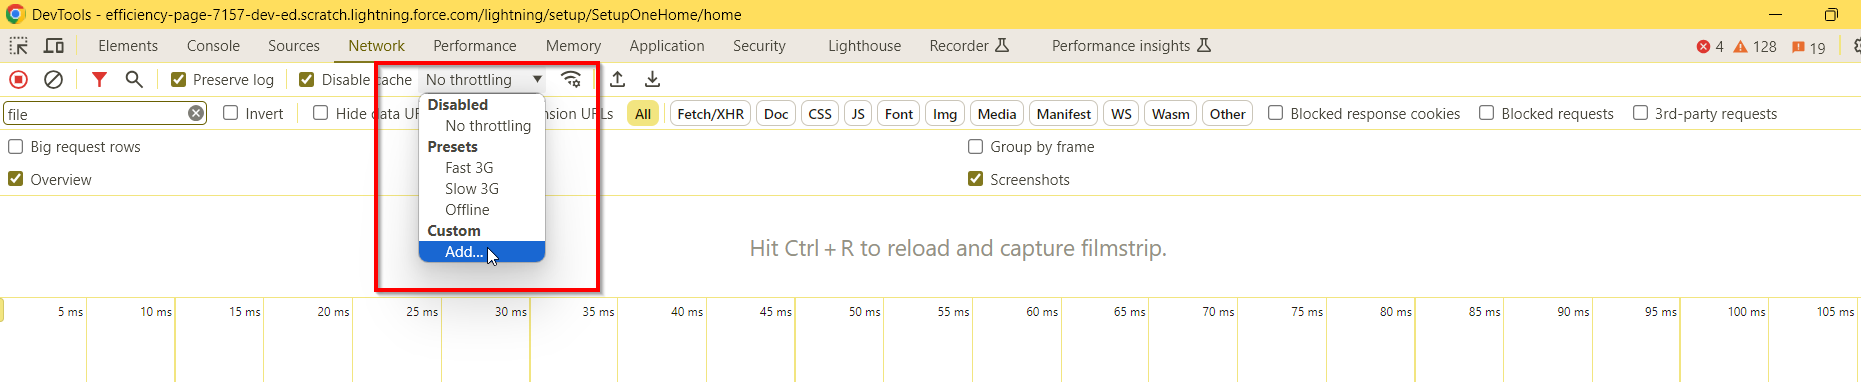
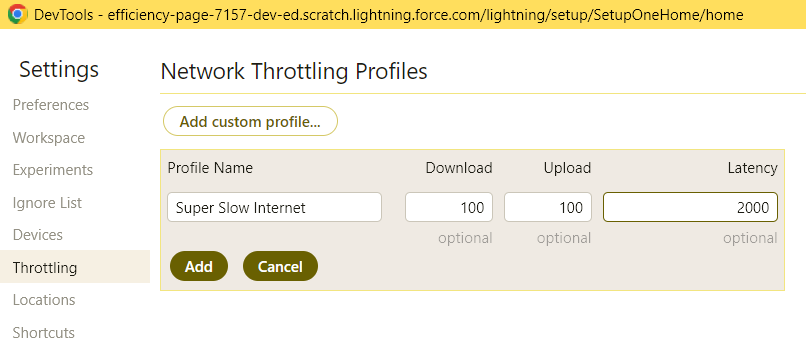
You can select the predefined parameters or create a custom throttling profile and specify the exact throttling parameters.
DOM breakpoints
There are situations when you’d like to inspect styles of the element dynamically added and removed from DOM. An example of that is standard Salesforce hover functionality.
Let’s say that I’d like to inspect the styles of the panel displayed when I hover over my price book name.
I’m not able to easily do that, because it is removed from the DOM whenever the mouse goes outside of it.
Luckily, I’m able to set up a breakpoint on the element container’s subtree modification – that way the execution will be stopped whenever child elements are added or removed from the DOM.
I don’t know the exact parent of my disappearing price-book panel, so I’ll set up the breakpoint on the outermost container I see. As a result, the debugger will stop not only on my disappearing panel addition but also for any other container’s child. I’ll have to resume the execution until I see my panel.
Note: you can also set a breakpoint for the attributes modification or specific node removal.
Find elements and copy selectors
You can search for elements in DOM by CSS selectors – open the Elements tab and press
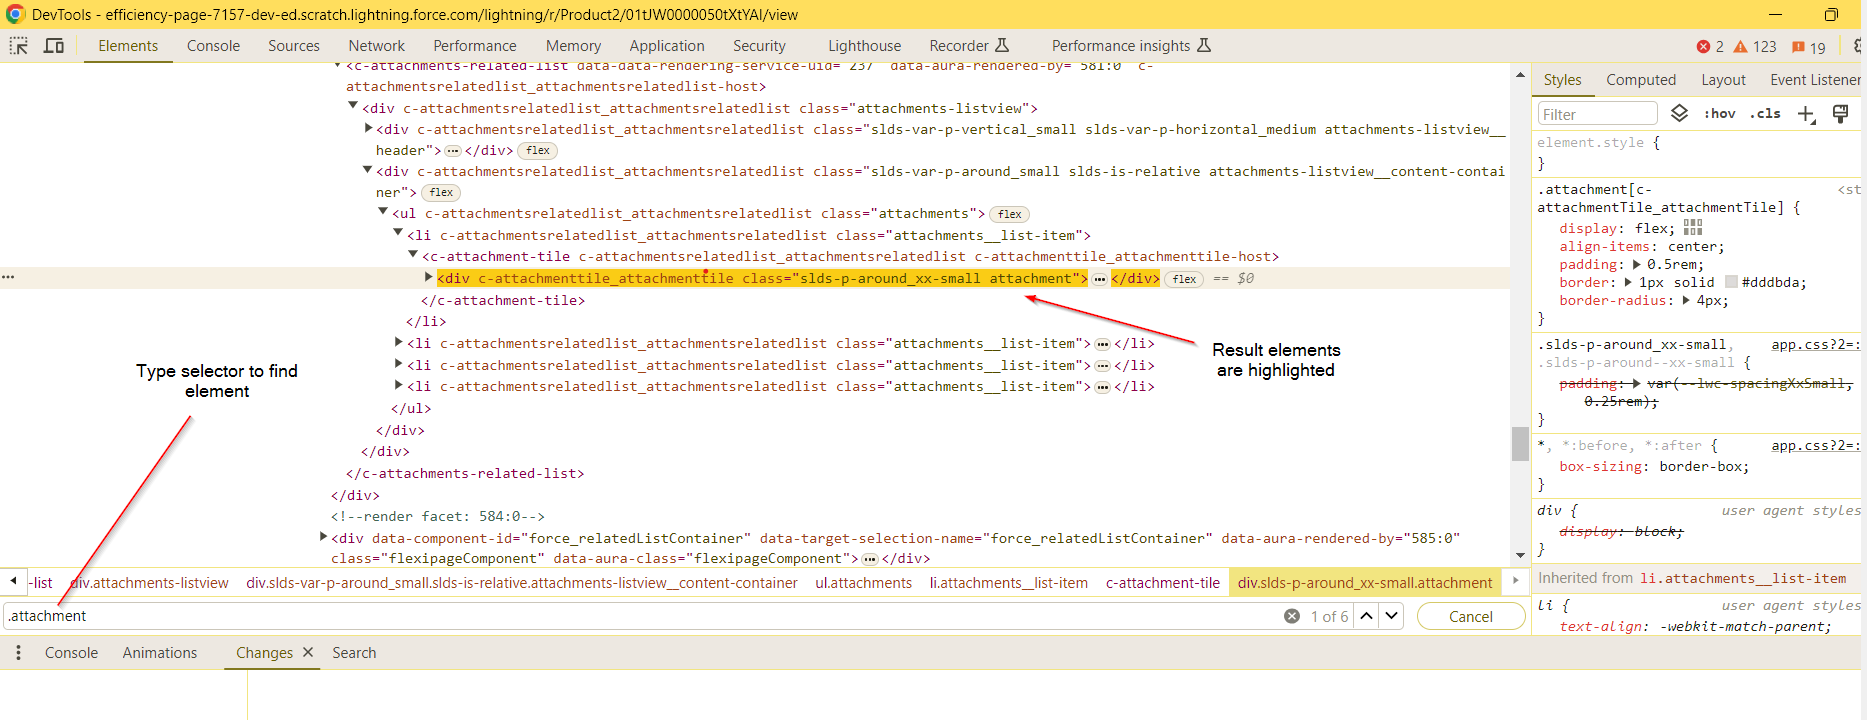
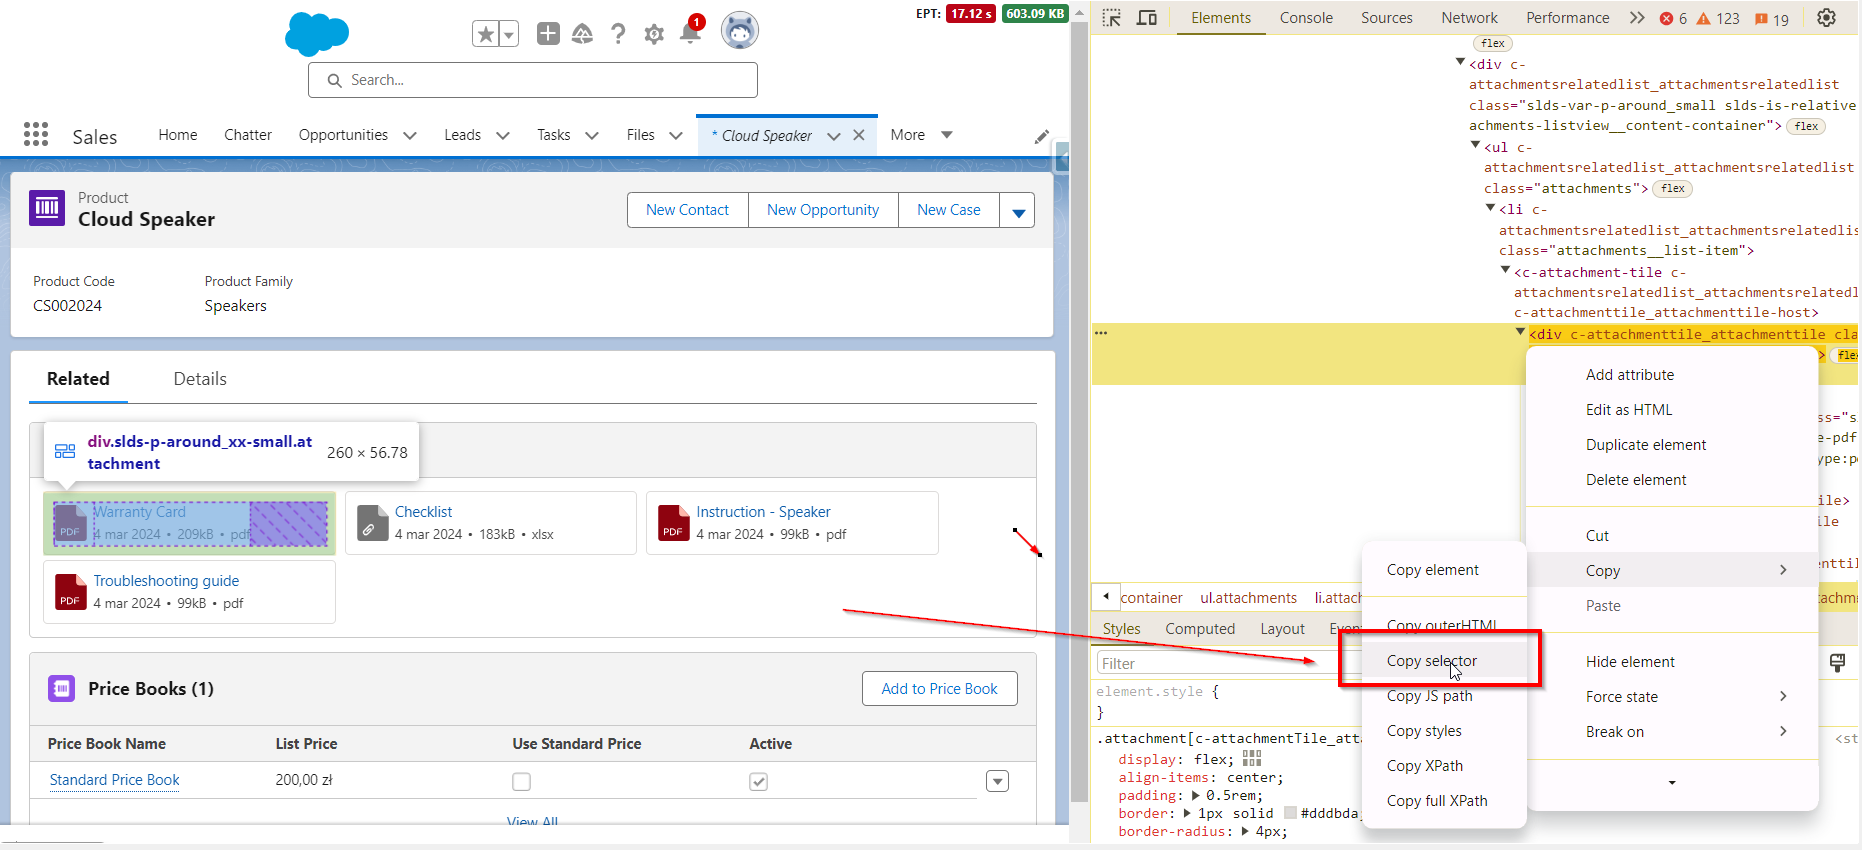
You can also copy selectors for the elements that you see in the DOM. Just right-click on any of them and select Copy selector. The copied selector will be very complex (including all the parent elements on the way), but it might be a good start. This feature is useful in many situations, for example when you prepare style overrides for the Experience Cloud site and you need selectors for standard template elements.
Inspect wired property or method
You can use Chrome Console Utility API to inspect the values returned by the wired method or stored in the wired property.
Select your component using the inspection tool and type $0 in the console.
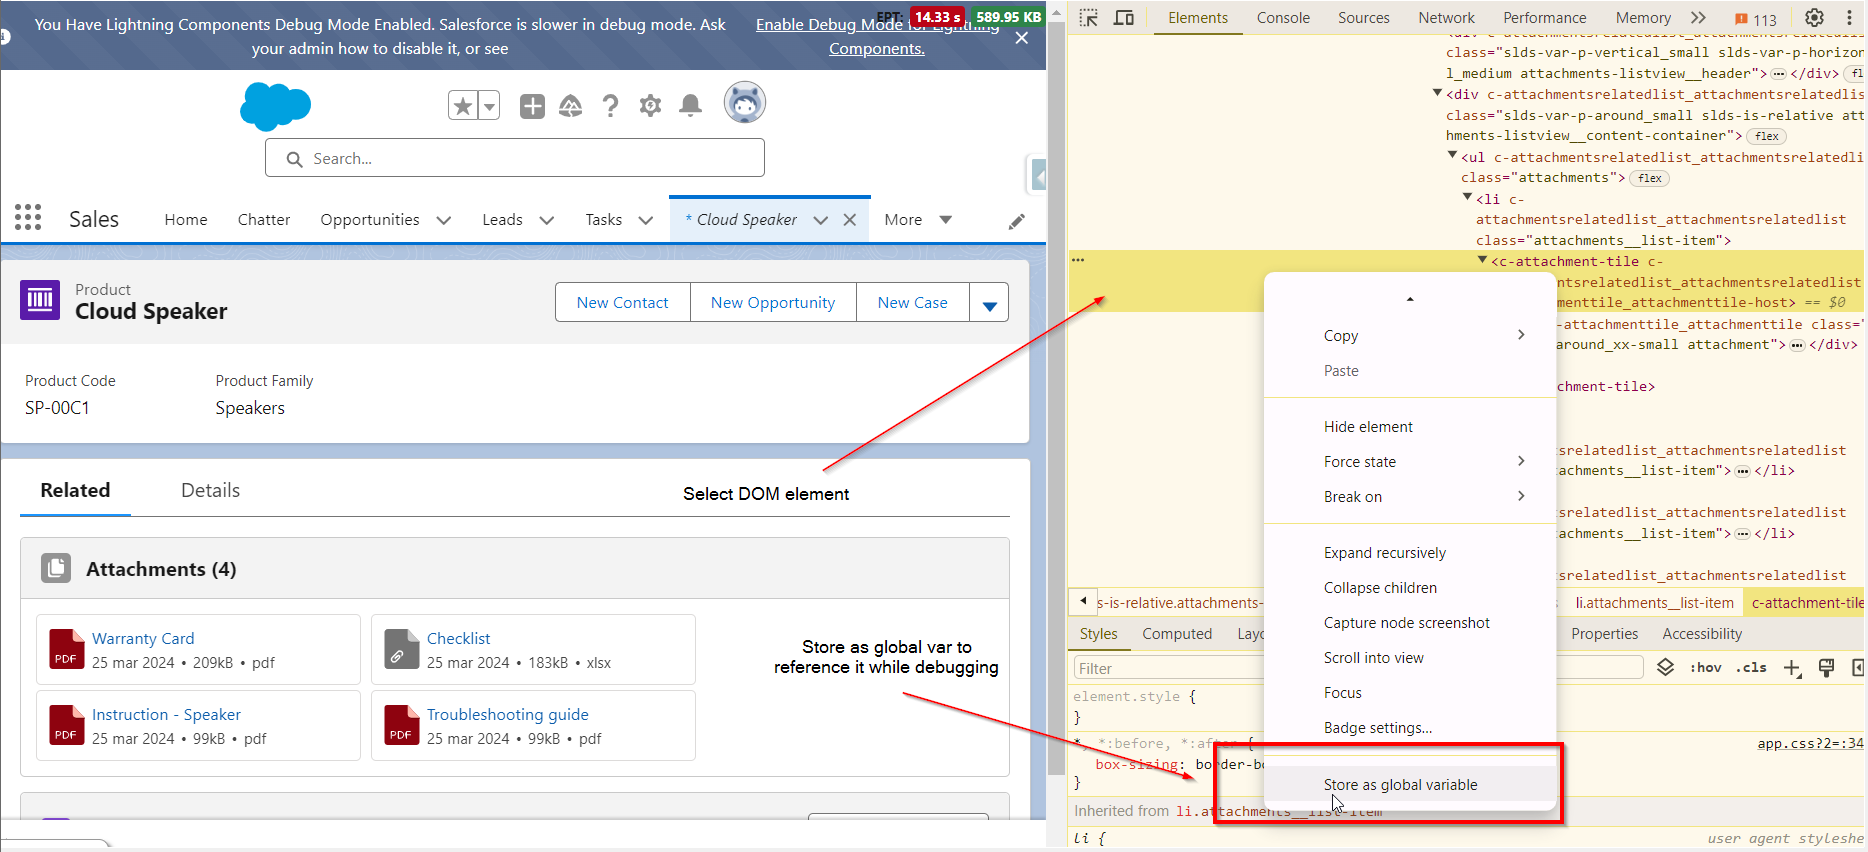
Store object or element as a global variable
There is an option to store a JavaScript var/object as a global variable to use it later. This might be useful when your app has printed something to the console and you want to experiment with that, or when you see some complex structured object during the debugging and you want to play with it outside of the debugger.
In the below example, I console.log the data returned by the wired method, save it to the global variable, and then experiment with it inside a snippet.
As you’ll see, the global var is by default named temp1 (if you had more, it would be temp2, temp3, and so on). All the globals saved this way will be cleared during the page refresh.
You can do a similar thing for the DOM elements – sometimes it is useful to reference child components (or specific nodes) while debugging JavaScript. Right-click the chosen element and select Store as global variable – it will be saved to temp1 (same as JavaScript globals).
Final words
That’s all I have for you this time.
Well-used Chrome Dev Tools can make frontend development much easier and much more pleasant. I hope you learned something new and the knowledge provided in this article will bring you more fun while implementing new LWCs.
If you have any questions or see that I missed some useful features, feel free to add a comment in the section below. 🙂

