
Apex Debugging
Hello,
In our daily routine, the most common practice to debug apex is the usage of debug logs. However, Salesforce provides more sophisticated methods that can be useful for you.
Would you like to learn about more efficient ways to debug apex code?
Let’s dive in!
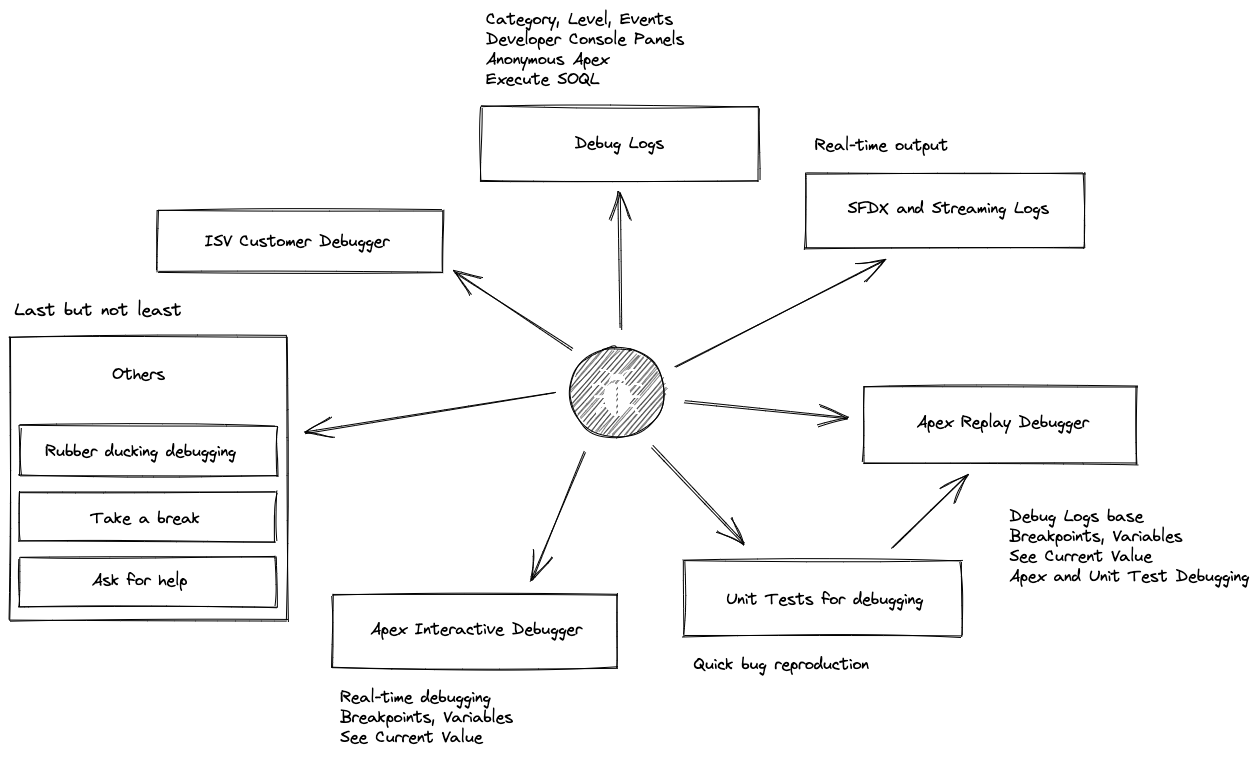
Overview

Debug Logs
The debug log contains information about each transaction, such as whether it was successful and how long it took. Depending on the filters set by your trace flags, the log can contain varying levels of detail about the transaction. ~ Salesforce
Setup > Debug Logs
Possible Tracked Entity Type:
- Automated Process
- Platform Integration
- User
- Apex Class
- Apex Trigger
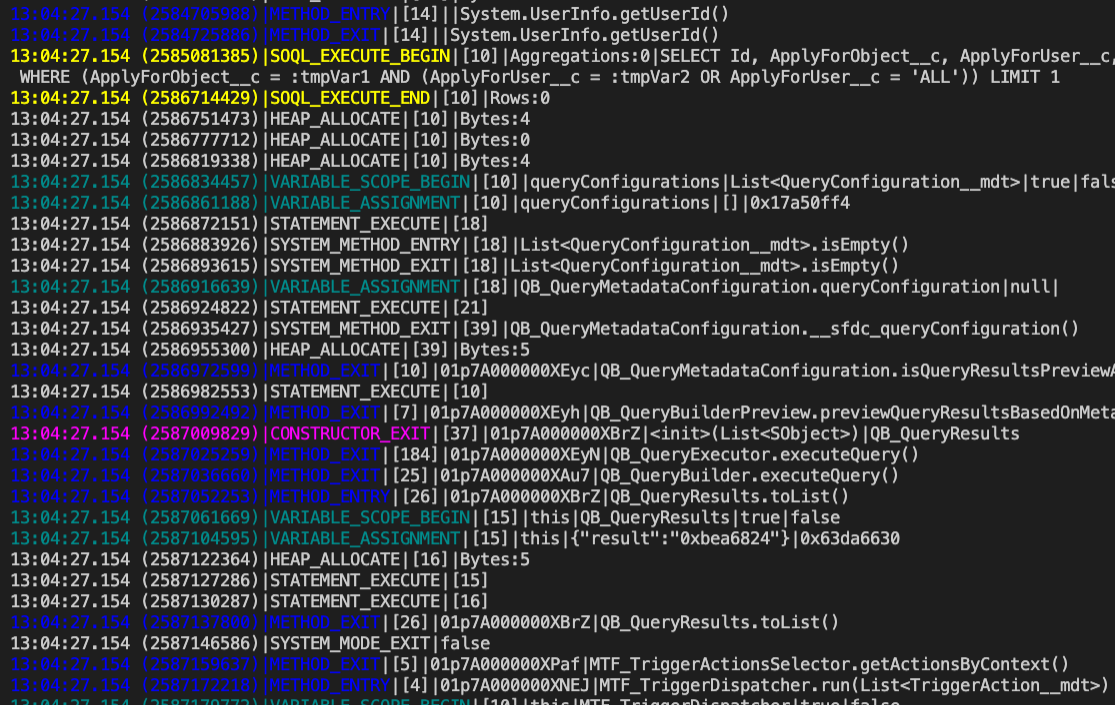
Debug log example:
55.0 APEX_CODE,FINEST;APEX_PROFILING,INFO;CALLOUT,INFO;DB,INFO;SYSTEM,DEBUG;
    VALIDATION,INFO;VISUALFORCE,INFO;WORKFLOW,INFO
Execute Anonymous: System.debug('Hello World!');
16:06:58.18 (18043585)|USER_INFO|[EXTERNAL]|005D0000001bYPN|devuser@example.org|
    Pacific Standard Time|GMT-08:00
16:06:58.18 (18348659)|EXECUTION_STARTED
16:06:58.18 (18383790)|CODE_UNIT_STARTED|[EXTERNAL]|execute_anonymous_apex
16:06:58.18 (23822880)|HEAP_ALLOCATE|[72]|Bytes:3
16:06:58.18 (24271272)|HEAP_ALLOCATE|[77]|Bytes:152
16:06:58.18 (24691098)|HEAP_ALLOCATE|[342]|Bytes:408
16:06:58.18 (25306695)|HEAP_ALLOCATE|[355]|Bytes:408
16:06:58.18 (25787912)|HEAP_ALLOCATE|[467]|Bytes:48
16:06:58.18 (26415871)|HEAP_ALLOCATE|[139]|Bytes:6
16:06:58.18 (26979574)|HEAP_ALLOCATE|[EXTERNAL]|Bytes:1
16:06:58.18 (27384663)|STATEMENT_EXECUTE|[1]
16:06:58.18 (27414067)|STATEMENT_EXECUTE|[1]
16:06:58.18 (27458836)|HEAP_ALLOCATE|[1]|Bytes:12
16:06:58.18 (27612700)|HEAP_ALLOCATE|[50]|Bytes:5
16:06:58.18 (27768171)|HEAP_ALLOCATE|[56]|Bytes:5
16:06:58.18 (27877126)|HEAP_ALLOCATE|[64]|Bytes:7
16:06:58.18 (49244886)|USER_DEBUG|[1]|DEBUG|Hello World!
16:06:58.49 (49590539)|CUMULATIVE_LIMIT_USAGE
16:06:58.49 (49590539)|LIMIT_USAGE_FOR_NS|(default)|
  Number of SOQL queries: 0 out of 100
  Number of query rows: 0 out of 50000
  Number of SOSL queries: 0 out of 20
  Number of DML statements: 0 out of 150
  Number of DML rows: 0 out of 10000
  Maximum CPU time: 0 out of 10000
  Maximum heap size: 0 out of 6000000
  Number of callouts: 0 out of 100
  Number of Email Invocations: 0 out of 10
  Number of future calls: 0 out of 50
  Number of queueable jobs added to the queue: 0 out of 50
  Number of Mobile Apex push calls: 0 out of 10

16:06:58.49 (49590539)|CUMULATIVE_LIMIT_USAGE_END

16:06:58.18 (52417923)|CODE_UNIT_FINISHED|execute_anonymous_apex
16:06:58.18 (54114689)|EXECUTION_FINISHED
Categories
Each debug level includes a debug log level for each of the following log categories.
The amount of information logged for each category depends on the log level.
| Log Category | Description |
|---|---|
| Database | Includes information about database activity, including every data manipulation language (DML) statement or inline SOQL or SOSL query. |
| Workflow | Includes information for workflow rules, flows, and processes, such as the rule name and the actions taken. |
| NBA | Includes information about Einstein Next Best Action activity, including strategy execution details from Strategy Builder. |
| Validation | Includes information about validation rules, such as the name of the rule and whether the rule evaluated true or false. |
| Callout | Includes the request-response XML that the server is sending and receiving from an external web service. Useful when debugging issues related to using Lightning Platform web service API calls or troubleshooting user access to external objects via Salesforce Connect. |
| Apex Code | Includes information about Apex code. Can include information such as log messages generated by DML statements, inline SOQL or SOSL queries, the start and completion of any triggers, and the start and completion of any test method. |
| Apex Profiling | Includes cumulative profiling information, such as the limits for your namespace and the number of emails sent. |
| Visualforce | Includes information about Visualforce events, including serialization and deserialization of the view state or the evaluation of a formula field in a Visualforce page. |
| System | Includes information about calls to all system methods such as the System.debug method. |
Levels
Setup > Debug Logs > New > New Debug Level
Each debug level includes one of the following log levels for each log category.
The levels are listed from lowest to highest.
- NONE
- ERROR
- WARN
- INFO
- DEBUG
- FINE
- FINER
- FINEST
Event Types

Developer Console / Visual Studio Code
View Logs
Developer Console > Debug > Switch Perspective > All
Log Panels
- Stack Tree – hierarchy of items in a process.
- The Execution Tree – shows each operation.
- The Performance Tree – aggregates operations to give you a better look at the performance of an operation as a whole.
- Execution Stack – displays a “bottom-up” view of the currently selected item in the debug log, starting with the lowest level call, followed by the operation that triggered that call, and so on.
- Execution Log – contains the debug log for the current process.
- Source – contains the executed source code or the metadata definitions of entities used during the process, and lists how many times a line of code was executed.
- Variables – discovers when a variable is assigned a value and what that value is.
- Execution Overview
- Save order – displays a color-coded timeline of DML actions.
- Limits – displays overall system limits by name and amount used.
- Timeline – provides a visual representation of the time taken by each process.
- Executed Units – tab displays the system resources used by each item in the process.
Execute Anonymous Apex
Developer Console
Developer Console> Debug > Open Execute Anonymous Window
Visual Studio Code
Ctrl + Shift + P > SFDX: Execute Anonymous Apex with Currently Selected Text
Execute SOQL
Developer Console
Developer Console > Query Editor (tab)
Visual Studio Code
Ctrl + Shift + P > SFDX: Execute SOQL query
Apex Replay Debugger
Apex Replay Debugger is a free tool that allows you to debug your Apex code by inspecting debug logs using Visual Studio Code as the client. Running the replay debugger gives you the same features you expect from other debuggers. You can view variables, set breakpoints, and hover over variables to see their current value. ~ Salesforce
Visual Studio Code
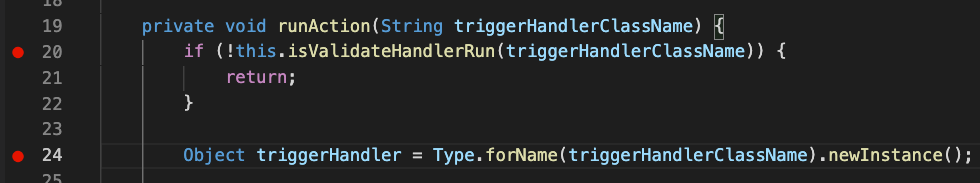
- Set line breakpoints. Open a .cls or .trigger file and click the column to the left of the line numbers.
Ctrl + Shift + P>SFDX: Turn On Apex Debug Log for Replay Debugger.- Reproduce the issue or Execute Anonymous Apex.
Ctrl + Shift + P>SFDX: Get Apex Debug Logs.- Select your log from the list.
Ctrl + Shift + P>Run SFDX: Launch Apex Replay Debugger with Current File.- Code will stop on your breakpoints (point #1).
Debug Your Unit Tests
Replicate the error more rapidly in code than through the UI and never have to leave IDE.
We will now know for sure when we have fixed the bug as the test will pass.
Visual Studio Code
- Set line breakpoints. Open a .cls or .trigger file and click the column to the left of the line numbers.
Ctrl + Shift + P>SFDX: Turn On Apex Debug Log for Replay Debugger.- Run your Unit Test. You can use this
Ctrl + Shift + P>SFDX: Run Apex Tests. Ctrl + Shift + P>SFDX: Get Apex Debug Logs.- Select your log from the list.
Ctrl + Shift + P>Run SFDX: Launch Apex Replay Debugger with Current File.- Code will stop on your breakpoints (point #1).
SFDX and Streaming Logs
Terminal > sfdx force:apex:log:tail --color – SFDX will now start outputting the debug logs from your org for your user line by line into the terminal window. This is useful, we can now inspect our debug logs as they come through in the terminal window to review the information within to find our bug.
sfdx force:apex:log:tail --color -d OWN_DEBUG_LEVEL
sfdx force:apex:log:tail --color -d DEV_DEBUG | grep USER_DEBUG – display only System.debug statements (USER_DEBUG)
Apex Interactive Debugger
Apex Debugger allows customers to debug their Apex code in sandboxes and scratch orgs, in real time, using VS Code as the client. ~ Salesforce
- Create Permission Set (e.g
Debug Apex) withSystem Permission>Enable Debug Apex. - Assign
Debug ApexPermission Set to your user. - In Visual Studio Code click the bug icon in the panel on the right side.
- Select
Launch Apex Debuggerfrom the picklist and click the green triangle to start. - Set line breakpoints. Open a .cls or .trigger file and click the column to the left of the line numbers.
- Upload your checkpoints to your org
Ctrl + Shift + P>SFDX: Update Checkpoints in Org. - Reproduce the issue or execute the code.
- Code will be stopped on your breakpoints (point #5).
To stop your active session, in VS Code, run Ctrl + Shift + P > SFDX: Stop Apex Debugger Session.
To kill your session go to Setup > Apex Debugger and see the list of all users using apex interactive debugger.
Others
- Rubber ducking debugging
Programmers would carry around a rubber duck and debug their code by forcing themselves to explain it, line-by-line, to the duck.
- Take a break
- Ask for help
Summary
If you have some questions feel free to ask in the comment section below. 🙂
Was it helpful? Check out our other great posts here.

