Apex CPU Benchmarking
Introduction
Have you ever encountered infamous Apex CPU time limit exception?
16:02:00.874 (15874183827)|EXCEPTION_THROWN|[2]|System.LimitException: Apex CPU time limit exceededIf so, you're probably well aware that it's not the easiest problem to solve. Usually, it indicates that there are deeper issues in your code, and it may take hours or even days to resolve them. In this post, I'd like to discuss the Apex CPU limit, how it behaves, and how to measure Apex performance. Specifically, we'll try to answer the question of how to determine whether your code is actually consuming a lot of CPU time. I won't be covering Apex best practices in this article since there are plenty of excellent resources available on that topic (Running Apex within Governor Execution Limits or Trailhead Module - Improve Your Apex Code). Instead, I want to take a deeper look at the lower level and focus solely on CPU time.
Basic information about Apex CPU time limit
The very first thing you probably learned about the Apex CPU time limit is that its value differs for synchronous and asynchronous transactions:
| Description | Synchronous Limit | Asynchronous Limit |
|---|---|---|
| Maximum CPU time on the Salesforce servers | 10000 ms | 60000 ms |
In theory, this means that your transaction should be terminated if it takes longer than 10 or 60 seconds. However, it's always better to verify this information for yourself. Let's create and deploy a simple class and test whether the values in the table are accurate.
public class CpuLimitCheck {

    @future
    public static void hitTheLimitAsync() {
        hitTheLimit();
    }

    public static void hitTheLimit() {
        Integer i = 0;
        while (true) {
            i++;
        }
    }
}
The CpuLimitCheck class contains a simple method that executes an infinite loop. To run this code (at least its asynchronous part), we need to create a test class:
@IsTest
public class CpuLimitCheckTest {

    @IsTest
    static void shouldHitTheCpuLimit() {
        Test.startTest();
        CpuLimitCheck.hitTheLimit();
        Test.stopTest();
    }

    @IsTest
    static void shouldHitTheCpuLimitAsync() {
        Test.startTest();
        CpuLimitCheck.hitTheLimitAsync();
        Test.stopTest();
    }
}
After deploying the class, turn on debug logs and run the first test method using the sfdx command:
sfdx force:apex:test:run --tests "CpuLimitCheckTest.shouldHitTheCpuLimit"
You should be able to retrieve the log and find the TESTING_LIMITS section at the end of the debug log.:
21:50:26.586 (48586043668)|TESTING_LIMITS
21:50:26.586 (48586043668)|LIMIT_USAGE_FOR_NS|(default)|
  Number of SOQL queries: 0 out of 100
  Number of query rows: 0 out of 50000
  Number of SOSL queries: 0 out of 20
  Number of DML statements: 0 out of 150
  Number of Publish Immediate DML: 0 out of 150
  Number of DML rows: 0 out of 10000
  Maximum CPU time: 15049 out of 10000 ******* CLOSE TO LIMIT
  Maximum heap size: 0 out of 6000000
  Number of callouts: 0 out of 100
  Number of Email Invocations: 0 out of 10
  Number of future calls: 0 out of 50
  Number of queueable jobs added to the queue: 0 out of 50
  Number of Mobile Apex push calls: 0 out of 10
In my case, the maximum CPU time is 15,049, which is 5 seconds more than the 10 seconds limit documented by Salesforce!
 Was it all a lie?
Lets check the result of asynchronous test:
sfdx force:apex:test:run --tests "CpuLimitCheckTest.shouldHitTheCpuLimitAsync"
Again, we can see that maximum CPU time is more than 5 seconds bigger than specified in the documentation!
22:04:41.653 (213653940442)|CUMULATIVE_LIMIT_USAGE
22:04:41.653 (213653940442)|LIMIT_USAGE_FOR_NS|(default)|
  Number of SOQL queries: 0 out of 200
  Number of query rows: 0 out of 50000
  Number of SOSL queries: 0 out of 20
  Number of DML statements: 0 out of 150
  Number of Publish Immediate DML: 0 out of 150
  Number of DML rows: 0 out of 10000
  Maximum CPU time: 65057 out of 60000 ******* CLOSE TO LIMIT
  Maximum heap size: 1171 out of 12000000
  Number of callouts: 0 out of 100
  Number of Email Invocations: 0 out of 10
  Number of future calls: 0 out of 50
  Number of queueable jobs added to the queue: 0 out of 1
  Number of Mobile Apex push calls: 0 out of 10
The reason behind that is Salesforce's Soft Limits Framework
Apex CPU as a "Soft Limit"
The Soft Limit Framework is a Salesforce approach for allowing users to use some resources if it will not cause overall performance degradation for the system. If your org is not negatively impacting the health of the system by bursting above the limit, Salesforce should allow you to do so.
Salesforce monitors its resource utilization in real-time. If it is very high and there is a risk that allowing one user to burst the limit could cause an impact on another customer's org, Salesforce will not let you exceed the threshold limit.
Soft limits are mostly applied to transactional limits such as:
- CPU
- Heap Size
- Number of Concurrent Transactions
In contrast to soft limits, there are some "hard" limits that cannot be exceeded, such as:
- Total number of SOQL queries issued
- Total number of DML statements issued
(Check this link for all Execution Governors and Limits)
More details about the Soft Limit approach can be found in this excellent Dreamforce session
CPU Time consumption
During the transaction, both programmatic and declarative automations are consuming the CPU time. This includes, for example:
- Validation Rules
- Formula calculations (formula values are not stored in the database, they are calculated when value is requested)
- Flows
- Workflows
- Processes
- Automations in installed managed packages
There are some operations that do not actually consume the CPU time, such as:
- Database operations (DML and most queries)
- Callouts (when Salesforce is waiting for a response from an external resource, CPU time limit is not consumed but it has hard limit of timeout - 120 seconds).
When the limit is exceeded, Salesforce throws a System.LimitException, which cannot be handled. The transaction is terminated immediately, and all database changes are rolled back. The only exception to this rule are Platform Events. If they were published immediately, they will not be rolled back, which can be used for creating an error logging framework.
It is also worth mentioning that certified Managed Packages gets its own set of limits and the only exception from this rule is CPU time limit which is always shared across all of the code in the org. This shows that it is even more important for ISV to put a lot of emphasis into limiting the CPU consumption if possible.
CPU Time benchmarking
I'm sure most Salesforce developers, whether they're coding or using declarative tools, understand why it's important to care about CPU time consumption. But how can we determine the best ways to save precious milliseconds of CPU time? I'd like to present a simple method for measuring transaction time that was originally described in Dan Appleman's book, Advanced Apex Programming
To begin, let's create a simple Apex class that will help us collect and display the results of our measurements::
@IsTest
public class BenchmarkUtilTest {

    private static Integer referenceStartTime;
    private static Integer referenceEndTime;
    private static Integer targetStartTime;
    private static Integer targetEndTime;

    public void markReferenceStartTime() {
        referenceStartTime = Limits.getCpuTime();
    }

    public void markReferenceEndTime() {
        referenceEndTime = Limits.getCpuTime();
    }

    public void markTargetStartTime() {
        targetStartTime = Limits.getCpuTime();
    }

    public void markTargetEndTime() {
        targetEndTime = Limits.getCpuTime();
    }

    public void reportResults(Integer loops) {
        if(targetEndTime == null) {
            this.markTargetEndTime();
        }

        Integer referenceDuration = referenceEndTime - referenceStartTime;
        Integer targetDuration = targetEndTime - targetStartTime;
        Integer benchmarkResults = targetDuration - referenceDuration;

        Decimal singleOperationInMicroseconds = benchmarkResults * 1000;
        singleOperationInMicroseconds /= loops;
        singleOperationInMicroseconds.setScale(2);

        Decimal singleReferenceOperationInMicroseconds = referenceDuration * 1000;
        singleReferenceOperationInMicroseconds /= loops;
        singleReferenceOperationInMicroseconds.setScale(2);

        Decimal singleTargetOperationInMicroseconds = targetDuration * 1000;
        singleTargetOperationInMicroseconds /= loops;
        singleTargetOperationInMicroseconds.setScale(2);

        System.debug(LoggingLevel.Error, 'Reference Duration: ' + referenceDuration + '( ' singleReferenceOperationInMicroseconds +  'μs per operation) Target duration: ' + targetDuration +
                ' Benchmark Results: ' + benchmarkResults +
                'ms or ' + singleOperationInMicroseconds + ' μs per operation');
    }
}
All of the code used in this article has been committed to the following GitHub repository: https://github.com/beyond-the-cloud-dev/apex-code-benchmarking. You can find the BenchmarkUtilTest class there, which we will be using in our unit tests to set the start and end time of the transaction and then report the result via System.debug statements.
To ensure the best possible accuracy of our measurements, it's important to remove any System.debug statements from the tested code before starting the test. These statements can significantly increase CPU time consumption, which is why they should always be avoided in production code. Additionally, we should set the debug level to the lowest possible setting to reduce the amount of logs generated by our transaction.
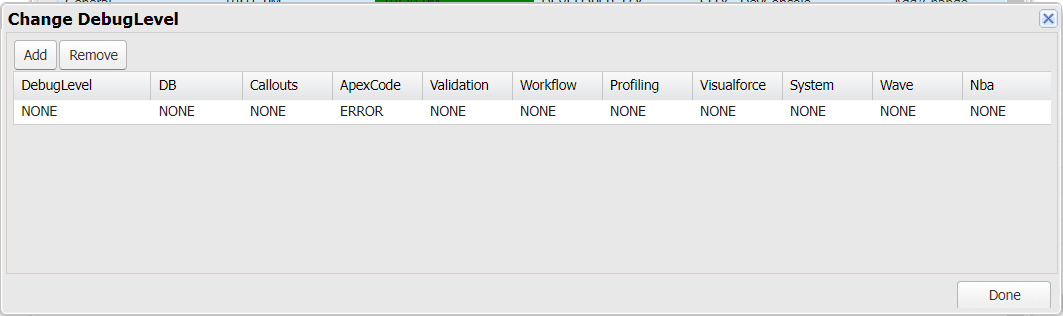
Please note that we are setting all levels (except ApexCode) to NONE, and the debug level for Apex Code is set to ERROR. This configuration ensures that we see the minimum number of logs, including those generated by statements that use:
System.debug(LoggingLevel.Error, 'debug statement');Creating first CPU performance test
Now we are ready to start benchmarking our code!
Here is the simplest possible example to see how to check the exact CPU time of a simple operation. Let's go through it line-by-line:
@IsTest
static void exampleTest() {

    BenchmarkUtilTest b = new BenchmarkUtilTest();
    Integer loops = 1000000;

    b.markReferenceStartTime();
    for(Integer i = 0; i < loops; i++) {}
    b.markReferenceEndTime();

    Integer intgr = 0;
    b.markTargetStartTime();
    for(Integer i=0; i< loops; i++) {
        intgr = 2+2;
    }
    b.markTargetEndTime();

    b.reportResults(loops);
}
    BenchmarkUtilTest b = new BenchmarkUtilTest();
    Integer loops = 1000000;
To start our CPU performance test, we need to set it up by first getting the BenchmarkUtil instance and specifying the number of loops. Generally, more loops provide more accurate results, so it's recommended to set this value as high as possible using trial and error. However, if our performance test involves DMLs or SOQL queries, it's important to set a lower number of loops to avoid bursting the limit.
    b.markReferenceStartTime();
    for(Integer i = 0; i < loops; i++) {}
    b.markReferenceEndTime();
Next, we need to set up the reference operation. In this case, we want to measure how much time will be consumed by our target operation. To achieve this, the reference operation is an empty loop. We want to subtract the time needed by the processor for the loop operation (reference time) from the target operation, to obtain an almost perfect measure of the CPU time consumed by the target operation. However, to get the most accurate results to the question of "which approach is faster?", I would recommend comparing one operation to another within a single transaction. I'll explain why later.
    Integer i = 0;
    b.markTargetStartTime();
    for(Integer i=0; i< loops; i++) {
        i = 2+2;
    }
    b.markTargetEndTime();
After setting up the reference operation, we can now perform the target operation that we want to benchmark. In this case, we are simply adding 2 and 2 within a loop. It's important to note that any additional setup or variable declarations should be executed after marking the reference end time and before marking the target start time to avoid interfering with the results.
b.reportResults(loops);Finally, we report the results.
In this example, the results are simply printed as debug logs, but they can be saved to a database or used in other ways as needed. However, if you plan to save the results to a database or use them in a more sophisticated way, you will need to remove the @IsTest annotation from your BenchmarkUtil and test classes.
Interpreting the results
I encourage you to deploy this test and start it multiple times on your org. Keep in mind that the result is going to be non-deterministic due to the multitenant nature of Salesforce. For example, when the system is under heavy load, it can take longer to execute a single operation. In my case, it took from 0.158 μs to 0.225 μs per single operation, indicating a significant variation in the results.
Of course to get some meaningfull data we have to compare two different operations. We can do that by creating two tests like this one showed above, or we can try to compare two actions in the same test:
Comparing two different code blocks in the same transaction
Let's compare two different approaches to incrementing an integer in Apex and measure their CPU time consumption in the same transaction. We'll compare the i++ operator with the i = i+1 approach.
It looks like a better idea than to run two separate test methods and then comparing them like in the previous example, but let me say that there are some drawbacks of this method that I'm going to mention later. Let's see the example:
@IsTest
static void compareTwoIncrementationMethods() {

    Integer x = 0;
    Integer y = 0;
    Integer loops = 1000000;

    BenchmarkUtilTest b = new BenchmarkUtilTest();

    // First operation to compare: ++ incrementation
    b.markReferenceStartTime();
    for(Integer i=0; i<1000000; i++) {
        x++;
    }
    b.markReferenceEndTime();

    // Second operation to compare: + incrementation
    b.markTargetStartTime();
    for(Integer i=0; i<1000000; i++) {
        y = y + 1;
    }
    b.markTargetEndTime();

    // Debug the results
    b.reportResults(1000000);

}| My result for this test case were as following: | x++ (μs/operation) | y = y + 1 (μs/operation) | difference (μs/operation) | difference (%) |
|---|---|---|---|---|
| 0,497 | 0,560 | 0,063 | 11 | |
| 0,374 | 0,549 | 0,175 | 32 | |
| 0,368 | 0,597 | 0,229 | 38 | |
| 0,379 | 0,621 | 0,242 | 39 | |
| 0,392 | 0,557 | 0,165 | 30 | |
| 0,409 | 0,599 | 0,190 | 32 |
Based on this test, it appears that incrementing using the ++ operator is faster than incrementing by adding 1 to the variable. However, it's important to keep in mind that the results include the time for loop processing, which can have a big impact on the final result for smaller and faster operations like incrementation (the empty loop took approximately 0.300-0.350 μs in similar conditions). Additionally, the research sample size was not big enough to draw a meaningful conclusion, and different conditions, orgs, and releases may yield different results. In my tests, there was a more than 30% difference in speed between the two methods, but your results may vary. What is more in some tests I observed that order of the operations might impact the result of the test (meaning that if I switched the order of compared operations then it turns out that the action which was second always appeared to be faster). This is why I think that the best approach is to always compare your code to the empty loop.
Summary
In this article, we discussed how to measure and compare the CPU time consumption of different code blocks in Salesforce
We learned how to create a CPU performance test. We also saw that the results of the test can be non-deterministic due to the multi-tenant nature of Salesforce, and that it's recommended to always compare your operation to empty loop to get the most accurate results if you look for an answer which operation is less CPU-consuming.
In the second part of this post we will compare few different Apex operations and try to find the answer to the question how to write faster code. Stay tuned!
If you have any questions, feel free to ask in the comment section below. Did you tried the test on your own? Or did you create another tests? Please share your results in the comment 🙂
Was it helpful? Check out our other great posts here.